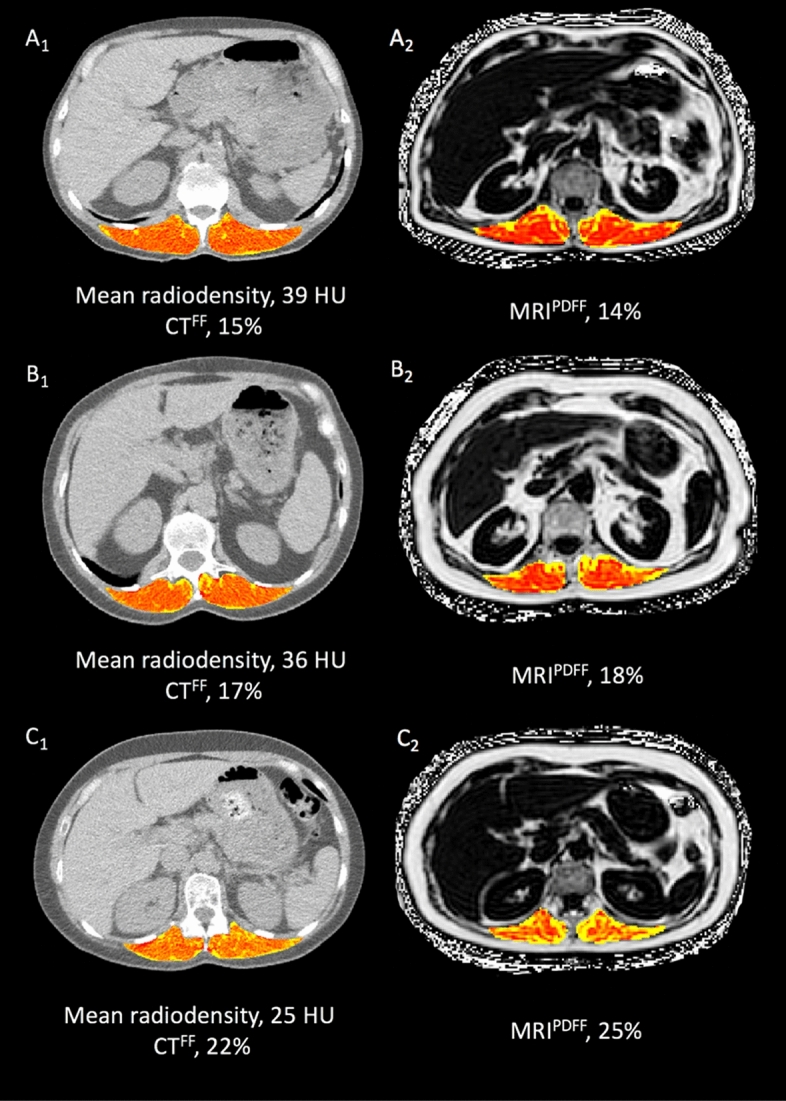
Figure 5.

Exemplary cross-sectional images of three subjects (A1/A2, B1/B2, C1/C2) from the study population illustrating agreement of CT and MRI derived muscle fat infiltration measurements. CT and MRI muscle fat infiltration were calculated as mean radiodensity in Hounsfield units (HU) and proton density fat fraction (MRIPDFF) in percent (%), respectively. Based on the correlation between CT and MRI muscle fat infiltration, a linear regression model was fit to calculate CT derived fat fraction (CTFF) from mean radiodensity based on the corresponding MRIPDFF values. CT computed tomography, MRI magnetic resonance imaging.
