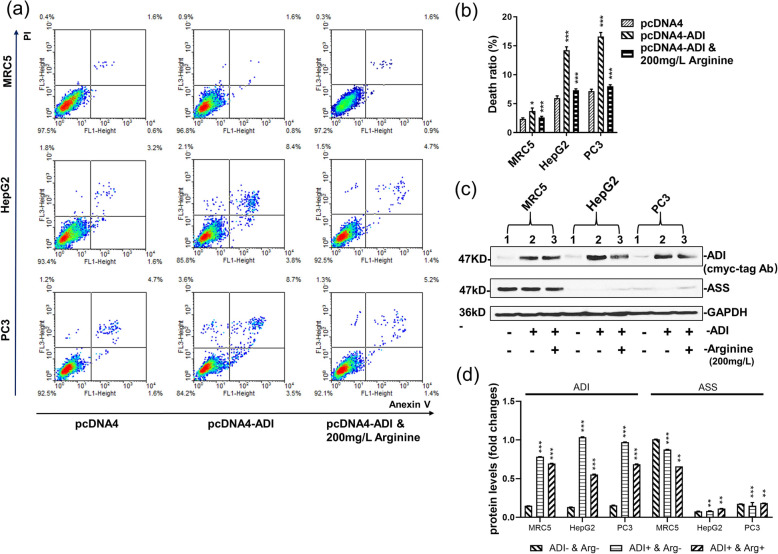
Fig. 1.
Apoptosis efficiency induced by ADI expressed in MRC5, HepG2 and PC3 cells. Cells were separately transfected by pcDNA4, pcDNA4-ADI plasmids. Cell apoptosis rates were detected by flow cytometry after the static cell culture for 48 h. a: Representative images of FACS analysis of annexin V and PI staining of MRC5, HepG2 and PC3 cells. b: Death ratio summary of FACS analysis from Fig. 1a. c: Immunoblots of ADI and ASS expression in MRC5, HepG2 and PC3 cells. C-myc-tag antibody was used to detect c-myc-tag-fused ADI. The blot of GAPDH was from the same gel as the blot of ADI. Full-length blots are presented in Supplementary Fig. S1. d: the relative quantification for protein expressions in MRC5, PC3 and HepG2 cell lines. Grey scales of protein bands from Fig. 1c were detected by ImageJ 1.52. P values were calculated by comparing pcDNA4-ADI plasmids-treated cells with pcDNA4 plasmid-treated cells in the respective cell lines. **P < 0.01; ***P < 0.001

