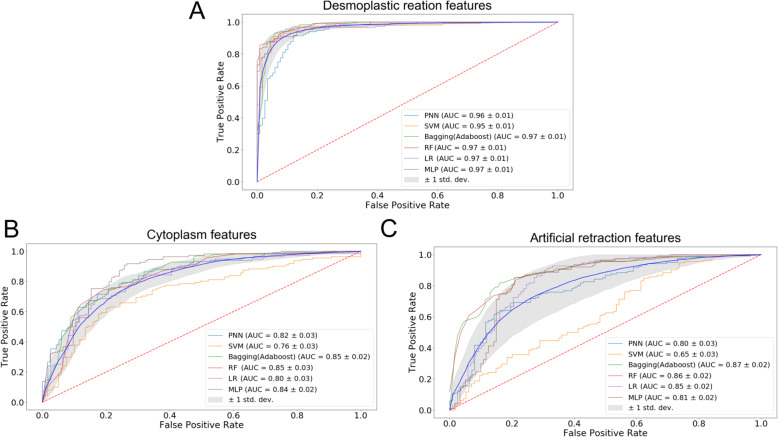
Fig. 8.
ROC curve of various ML classifiers based on features related to desmoplastic reaction (a), cytoplasmic/eosin intensity (b), and retraction artifact (c). There are 675, 13, and 15 features used to represent the desmoplastic reaction, cytoplasmic/eosin intensity and retraction artifact patterns, respectively. Several ‘background’ features were shared by the three patterns, leading to the sum of the features (i.e., 703) larger than the total number of features (i.e., 696). The features were incorporated into 6 ML classifiers to calculate the ROC curves. AUC values of the models were indicated in the caption. Twenty iterations were performed for each model. The mean ROC curve (blue) and standard deviation (grey shade area) are presented

