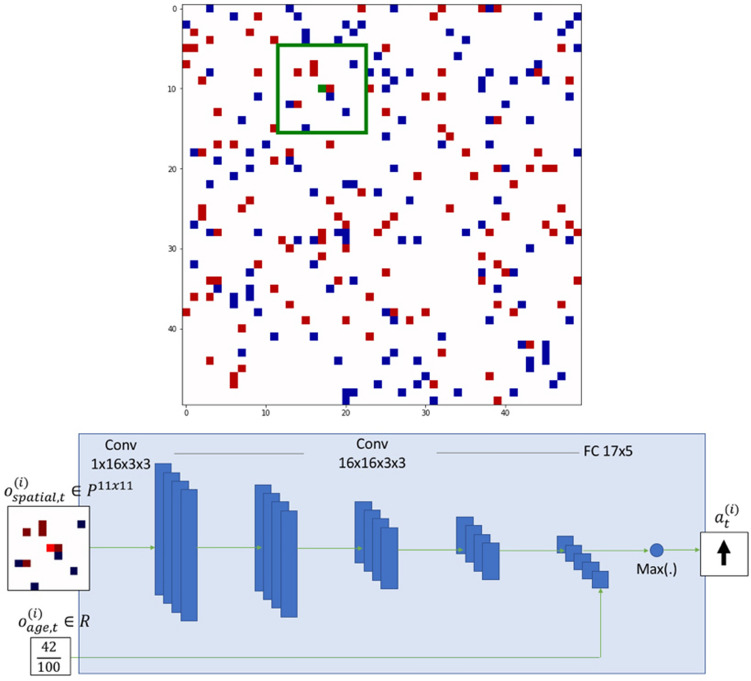
Figure 1.
Schematic of the model simulation and network architecture. Top panel: Grid world of experiments. The grid size is 50 50 locations. Red and blue squares denote the two types of agents respectively. White cells represents empty regions. Each type of agent has its own Deep Q-Network. Every agent has a field of view of 11 11 locations. Green border denotes the field of view of the agent illustrated in green. Agents can move across empty spaces. Bottom panel: Example of network structure. Two models are created for and respectively. Each network receives an input of 11 11 locations, runs it through five convolution steps and concatenates the resulting activations with the agent’s remaining age normalized by the maximum initial age. The feature vector is mapped over the action space using a fully connected layer. The action with the maximum Q-value is taken for the agent.

