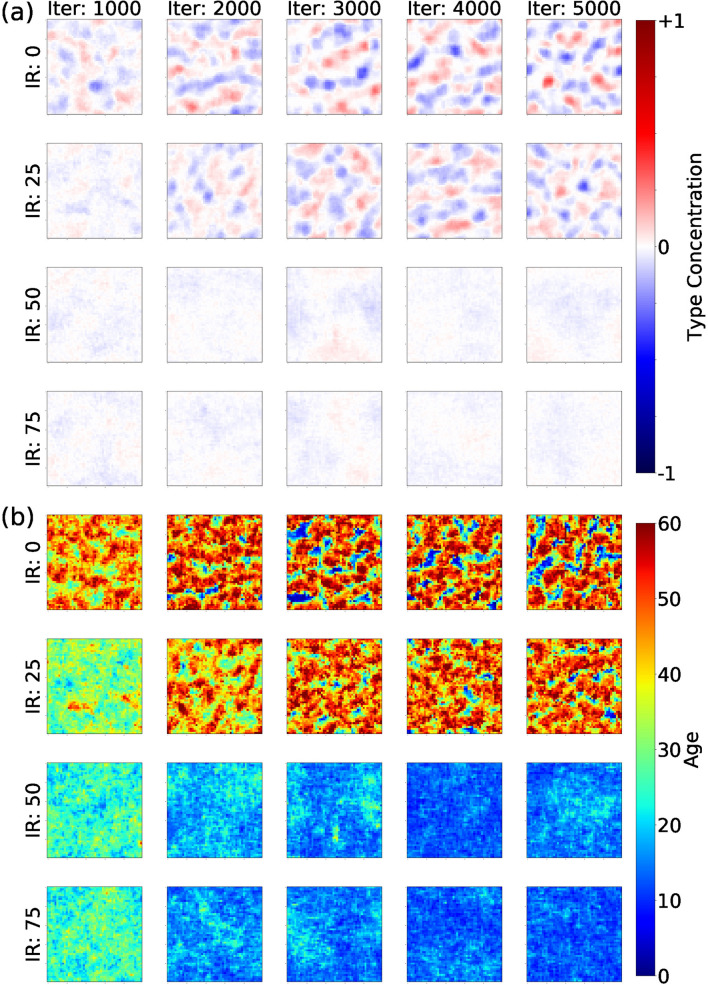
Figure 4.
Agents collective behavior for multiple values of interdependence reward (IR) at multiple times (columns) for maximum segregation parameter (). Rows represent outcomes associated to different values of interdependence reward (IR). Columns show the state of the system at different points of the simulation. In Panel (a) colors indicate the concentration of both types of agents (blue and red). White indicates the average pattern. In Panel (b) color indicates the age of agents irrespective of their type. Scales in figure.

