Figure 5.

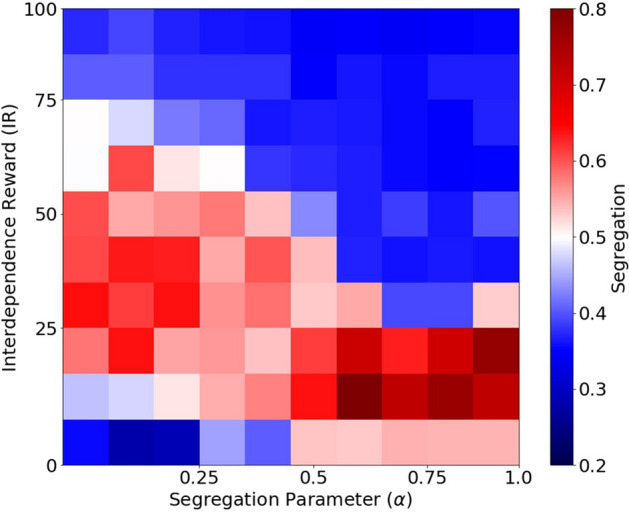
Segregation values for multiple values of segregation parameter () and interdependence reward (IR). Colors correspond to amount of segregation measured in the last 1,000 iterations of the simulation. Scale in figure.

Segregation values for multiple values of segregation parameter () and interdependence reward (IR). Colors correspond to amount of segregation measured in the last 1,000 iterations of the simulation. Scale in figure.