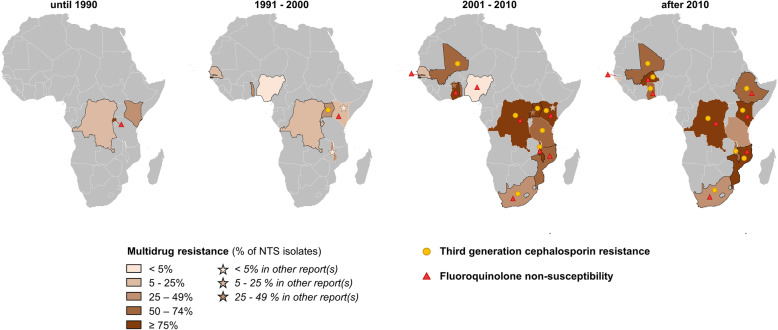
Fig. 4.
Spatiotemporal overview of the emergence of multidrug resistance, third-generation cephalosporin resistance, and fluoroquinolone non-susceptibility in invasive NTS infections in sub-Saharan Africa. The proportions of multidrug-resistant NTS per time period per country were represented by the choropleth. The presence of third-generation cephalosporin resistance or fluoroquinolone non-susceptibility was indicated with a circle or a star, respectively. For countries represented with black boundaries, the maximum proportion of multidrug-resistant NTS was plotted as no data on multidrug resistance were reported. The maximum proportion of multidrug-resistant NTS was determined as the lowest proportion among ampicillin, trimethoprim-sulfamethoxazole, and chloramphenicol resistance. For the sub-Saharan African countries in gray, no data were available. From 2001 to 2010, the maximum proportion of multidrug resistance in The Gambia was 19.4%, which is not clearly visible due to the small size of the country. For Rwanda in the period until 1990 and for The Gambia in the periods 2001–2010 and after 2010, the triangle indicating the presence of fluoroquinolone non-susceptibility is displayed right next to the respective country and connected to it with a thin line due to the small country sizes. NTS, non-typhoidal Salmonella

