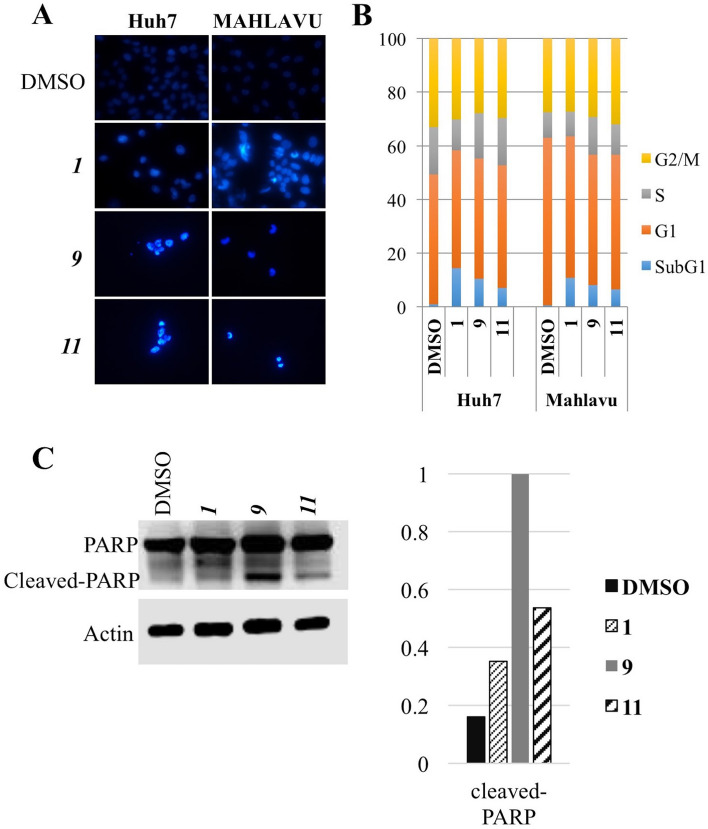
Figure 3.
Cell death induced by the chalcones. (A) Nuclear staining of the liver cancer cells treated with the chalcones. Human liver cancer cells (Huh7 and Mahlavu) were treated with the IC50 concentrations of the chalcones 1, 9, 11. After 72 h of incubation with the compounds or DMSO control, Hoechst (33258) staining was performed. Images were taken with fluorescent microscope (×40). Due to the strong cytotoxic activities of the chalcones the number of the cells in objective area was much less than DMSO controls. (B) Cell cycle distribution of liver cancer cells. Huh7 and Mahlavu cells were treated for 72 h with IC50 concentrations of the compounds or DMSO control. SubG1 cell cycle arrest was observed upon treatment with the compounds (blue). (C) Investigation of PARP cleavage in Huh7 and Mahlavu cells treated with the selected chalcones for 24 h.

