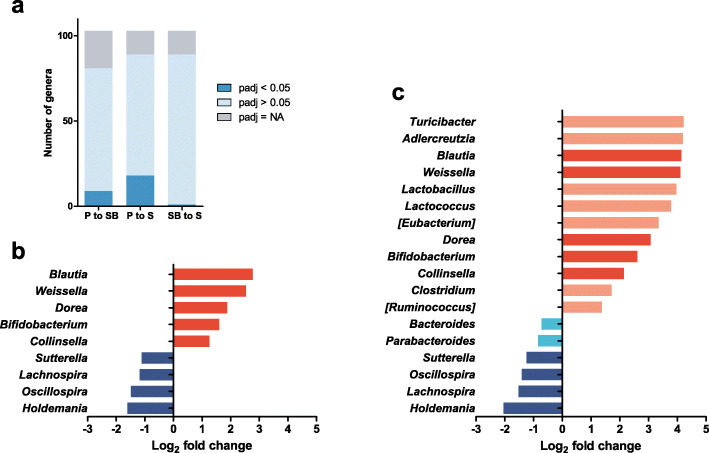
Fig. 4.
DESeq2 analysis identifying differentially abundant genera between samples obtained through protocols S, SB, and P. a The numbers of significantly differentially abundant genera (padj < 0.05), and non-significantly differentially abundant genera (padj > 0.05) among the 103 tested genera. b and c Genera to the right and the left of the zero line are more and less abundant in protocol P than in protocols SB b or S c, respectively. Brighter colored bars indicate that the genera were differentially abundant in protocol P in comparison only with protocol S, but not with protocol SB. Darker colored bars indicate that the genera were commonly differentially abundant in protocol P compared to both protocols SB and S

