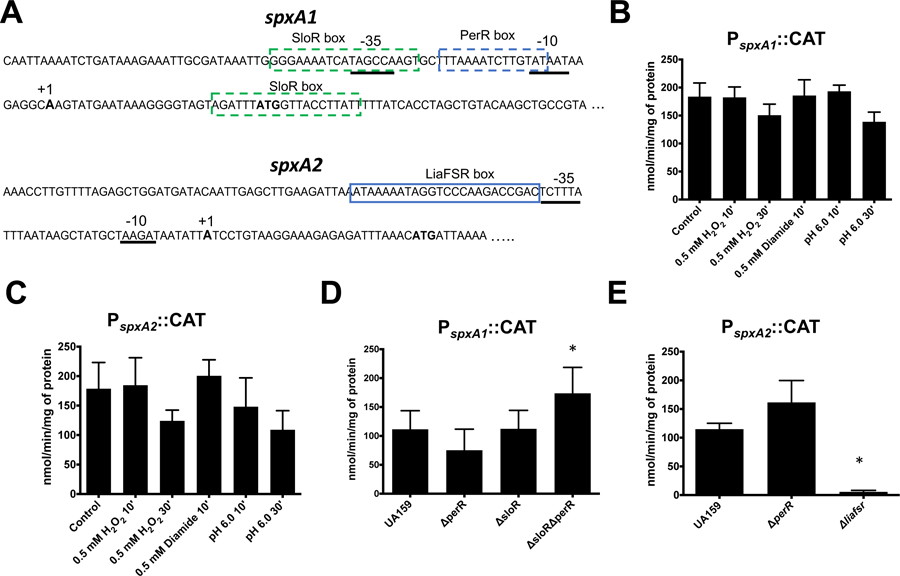
Figure 7.

Transcriptional characterization of S. mutans spxA1 and spxA2. (A) Sequence of the PspxA1 and PspxA2 promoter regions. The σA-type −35 and −10 regions, mapped by 5’ RACE-PCR, are underlined. The transcriptional start site is shown in boldface and labeled with “+1”. The ATG start codon is also shown in boldface. Putative PerR- and SloR-binding sites in PspxA1 and LiaR-binding site in PspxA2 are shown inside boxes. (B-E) CAT activity driven from PspxA1 or PspxA2. (B-C) Cells were grown to mid-log phase and incubated in the presence of H2O2 (0.5 mM), diamide (0.5mM) or pH 6.0 for 10 or 30 minutes. (D-E) Mutant strains harboring the indicated CAT fusions were grown to mid-log phase. Asterisks indicates statistical significance (p value ≤ 0.01) when compared to control (B-C) or UA159 (D-E) by one-way ANOVA.
