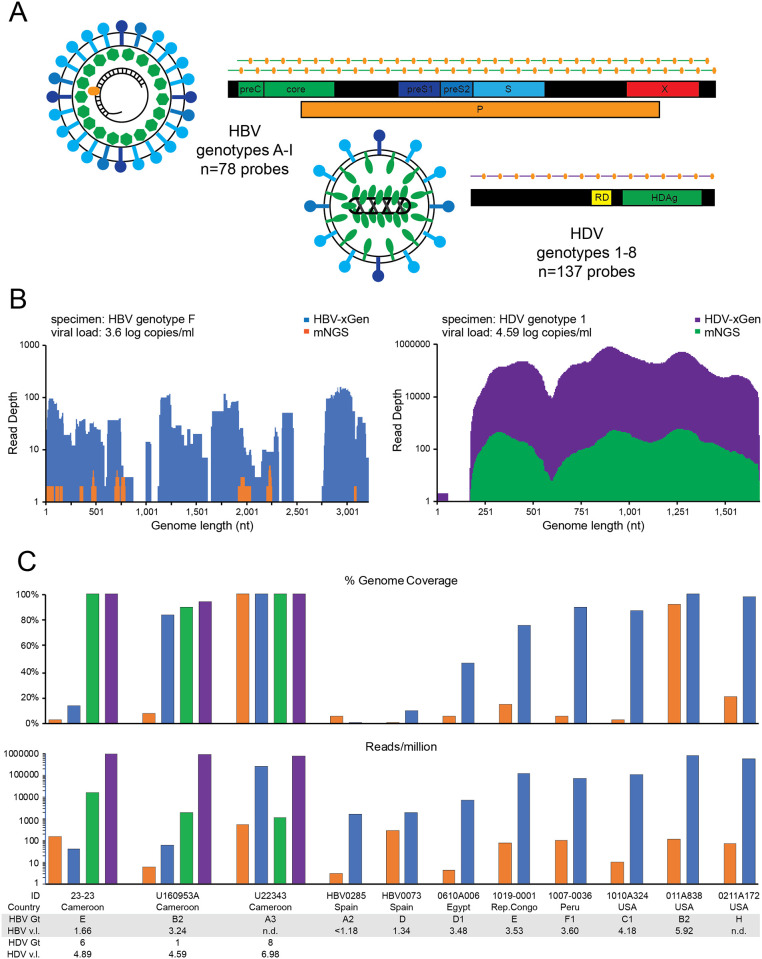
Fig 2. HBV/HDV-xGen greatly enhances sensitivity.
(A) HBV/HDV xGen probes tile HBV genotypes A-I with 2X coverage and HDV genotypes 1–8 with 1X coverage. (B) Representative genome coverage plots of NGS data for HBV (left) and HDV (right) strains from Cameroon. For HBV, mNGS reads are shown in orange and xGen reads in blue. For HDV, mNGS reads are shown in green and xGen reads in purple. (C) Histograms of coverage (top) and reads/million (bottom) on co-infections or HBV-only infections. Country, genotype, and viral load are listed beneath each plot with the same color scheme as in Fig 2B.

