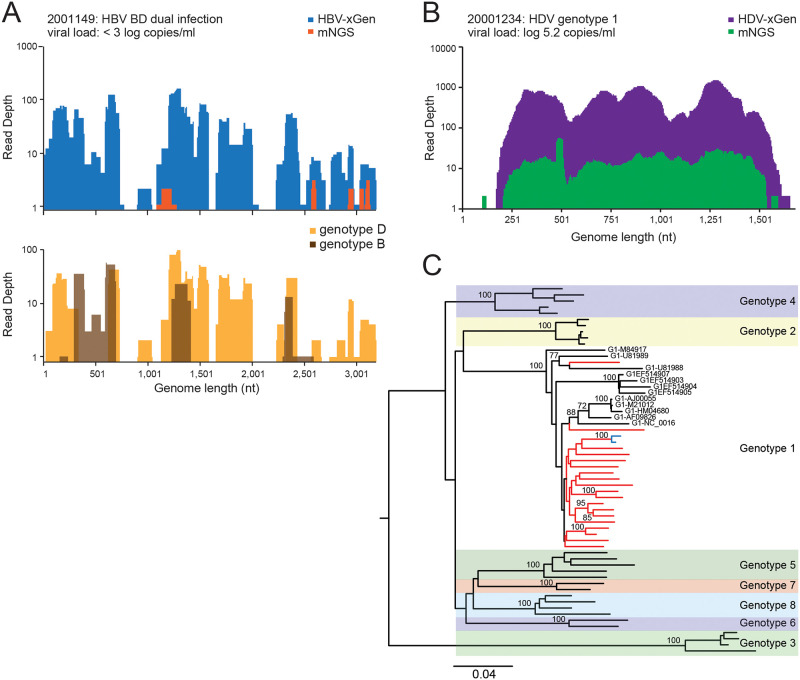
Fig 3. Dual BD infection and clustering of HDV genotype 1 strains in Israel.
(A) Coverage plot of HBV specimen, 2001149. mNGS reads are shown in orange and xGen reads in dark blue (upper panel). Genotype D1 reads are in gold and genotype B2 reads are in brown (lower panel). (B) Coverage plot of HDV specimen, 2001234. (C) Neighbor-joining phylogenetic tree of near full-length HDV sequences. New Israeli sequence branches are in red and reference strains are in black labeled with accession numbers. Bootstrap values of nodes >70 are shown.

