Figure 1.
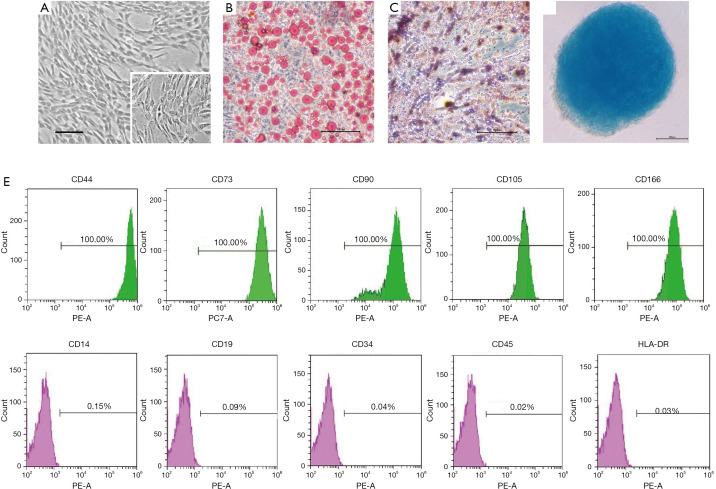
Biological characterization of hAdMSCs. (A) Representative micrographs of hAdMSCs morphology under light microscopy, magnification ×40; inset shows adherent hAdMSCs in higher magnification, ×100. Scale bar =50 µm. (B) Cultured hAdMSCs were differentiated into adipocytes identified by Oil Red O staining, and osteocytes by Alizarin Red S staining (C), chondrocytes by Alcian Blue staining (D). Magnification ×100, scale bars =100 µm. (E) Immunophenotypic characterization of hAdMSCs by FACS analysis. In the graphs, the X-axis represents fluorescence intensity and relative cell number is given on the Y-axis. Histograms show the specific antibody staining (green and pink peaks) and the percentage of cells positive for the selected antibodies.

