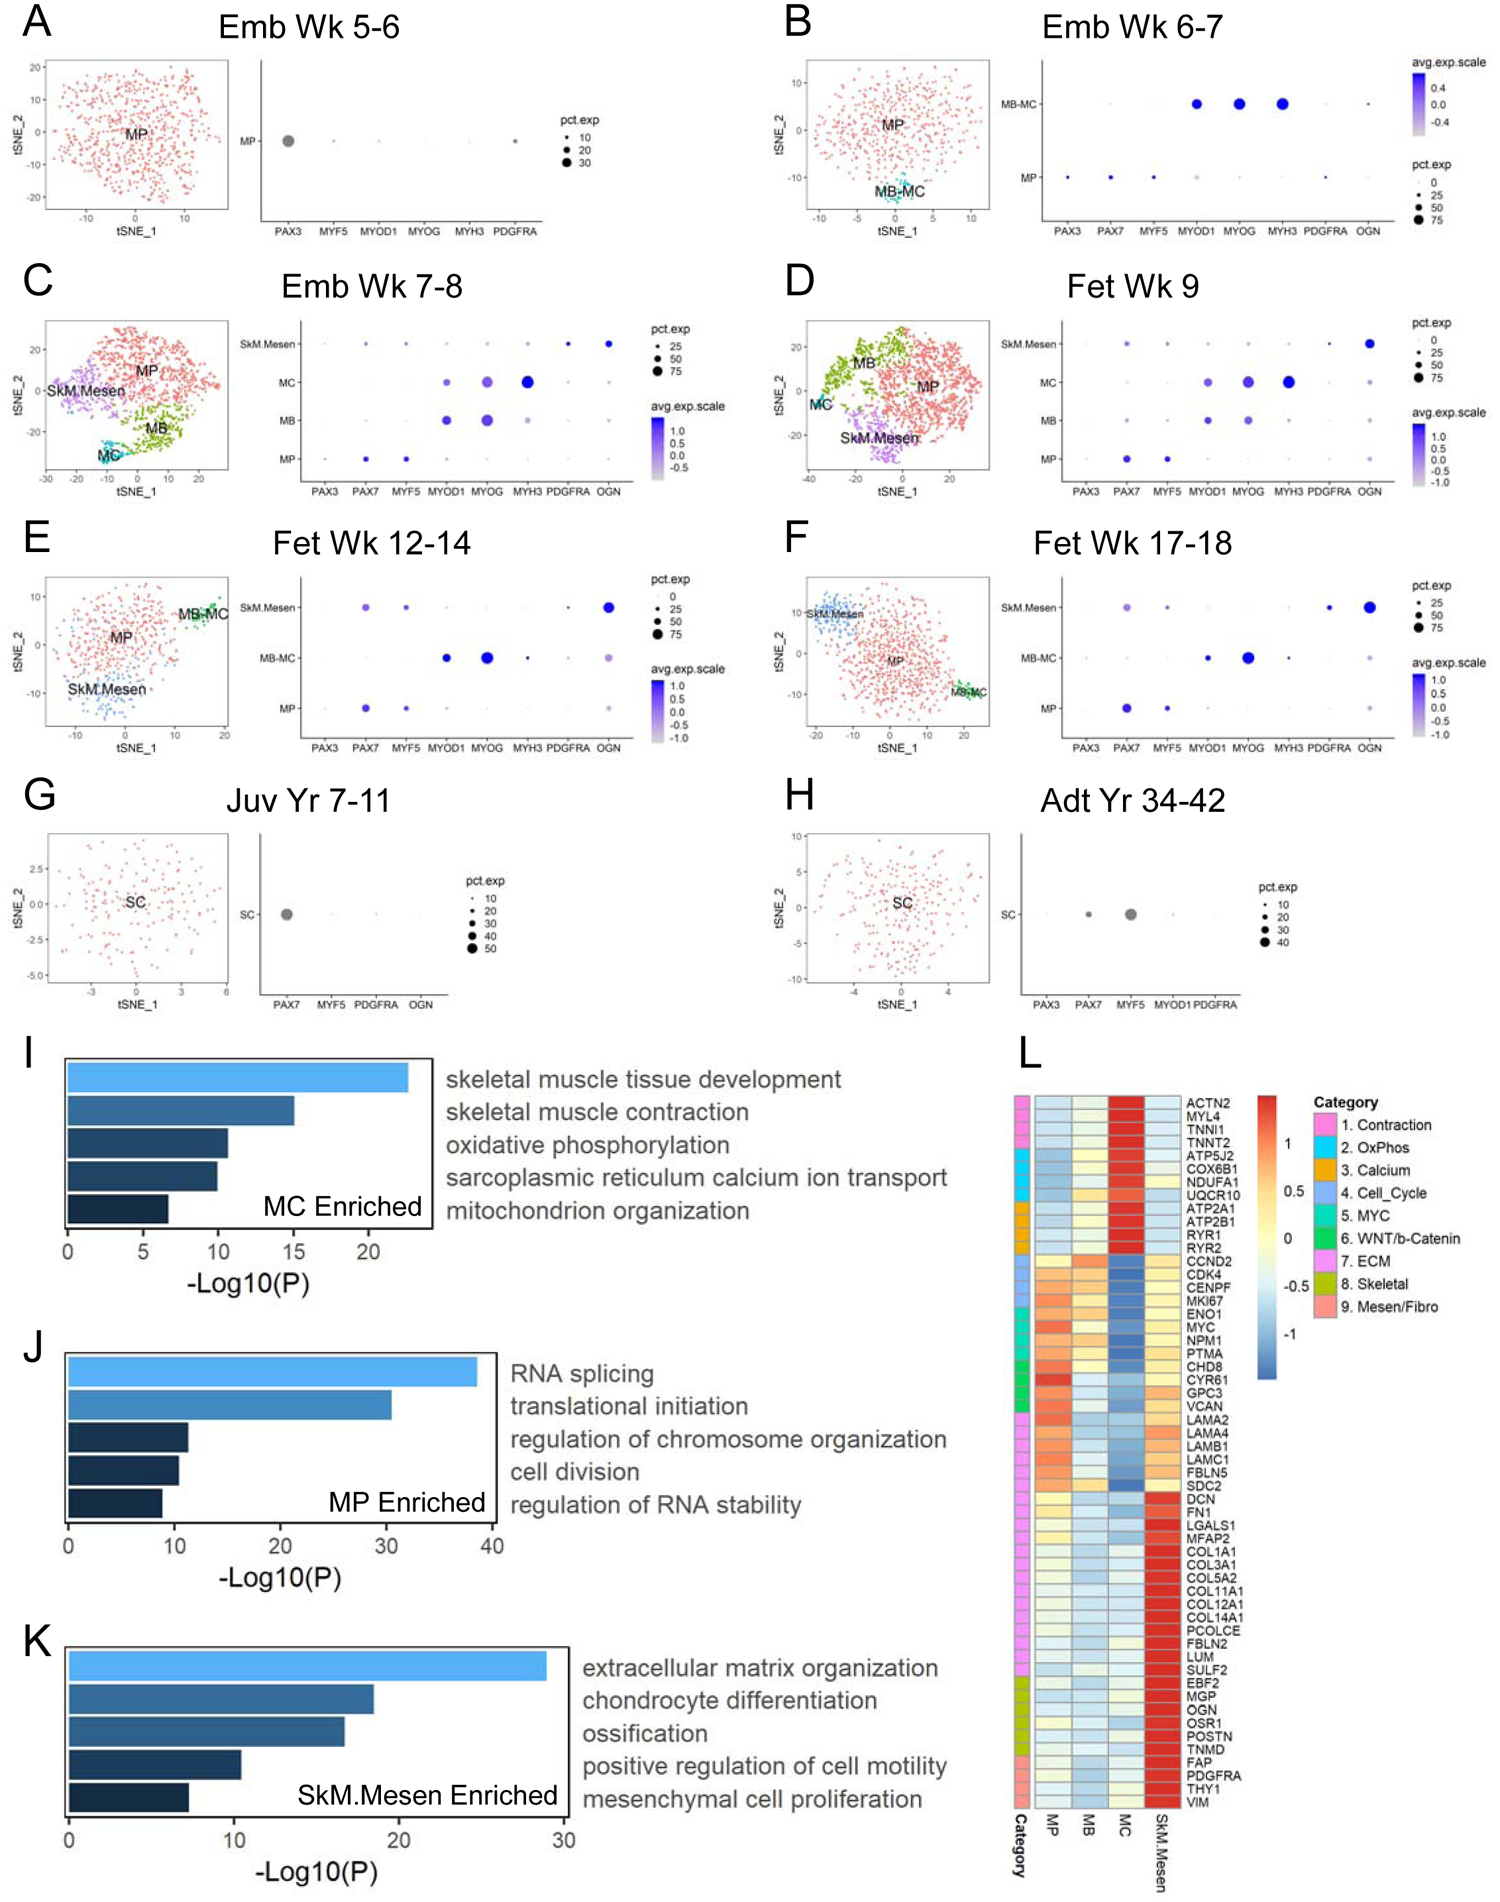
Figure 2. Different skeletal myogenic subpopulations are present across human development. See also Figure S2.

(A-H) Left panels: single cells classified as “SkM” within each age group on tSNE plots and colored by myogenic subtype. Right panels: dot plots of selected subtype markers. (I-K) Selected enriched GO terms from DEGs enriched in MC vs. MP (I), MP vs. MC (J) or SkM.Mesen vs. the main SkM subpopulations (MP, MB and MC) (K). (L) Heatmap of selected markers of different pathways across averaged SkM subpopulations.
