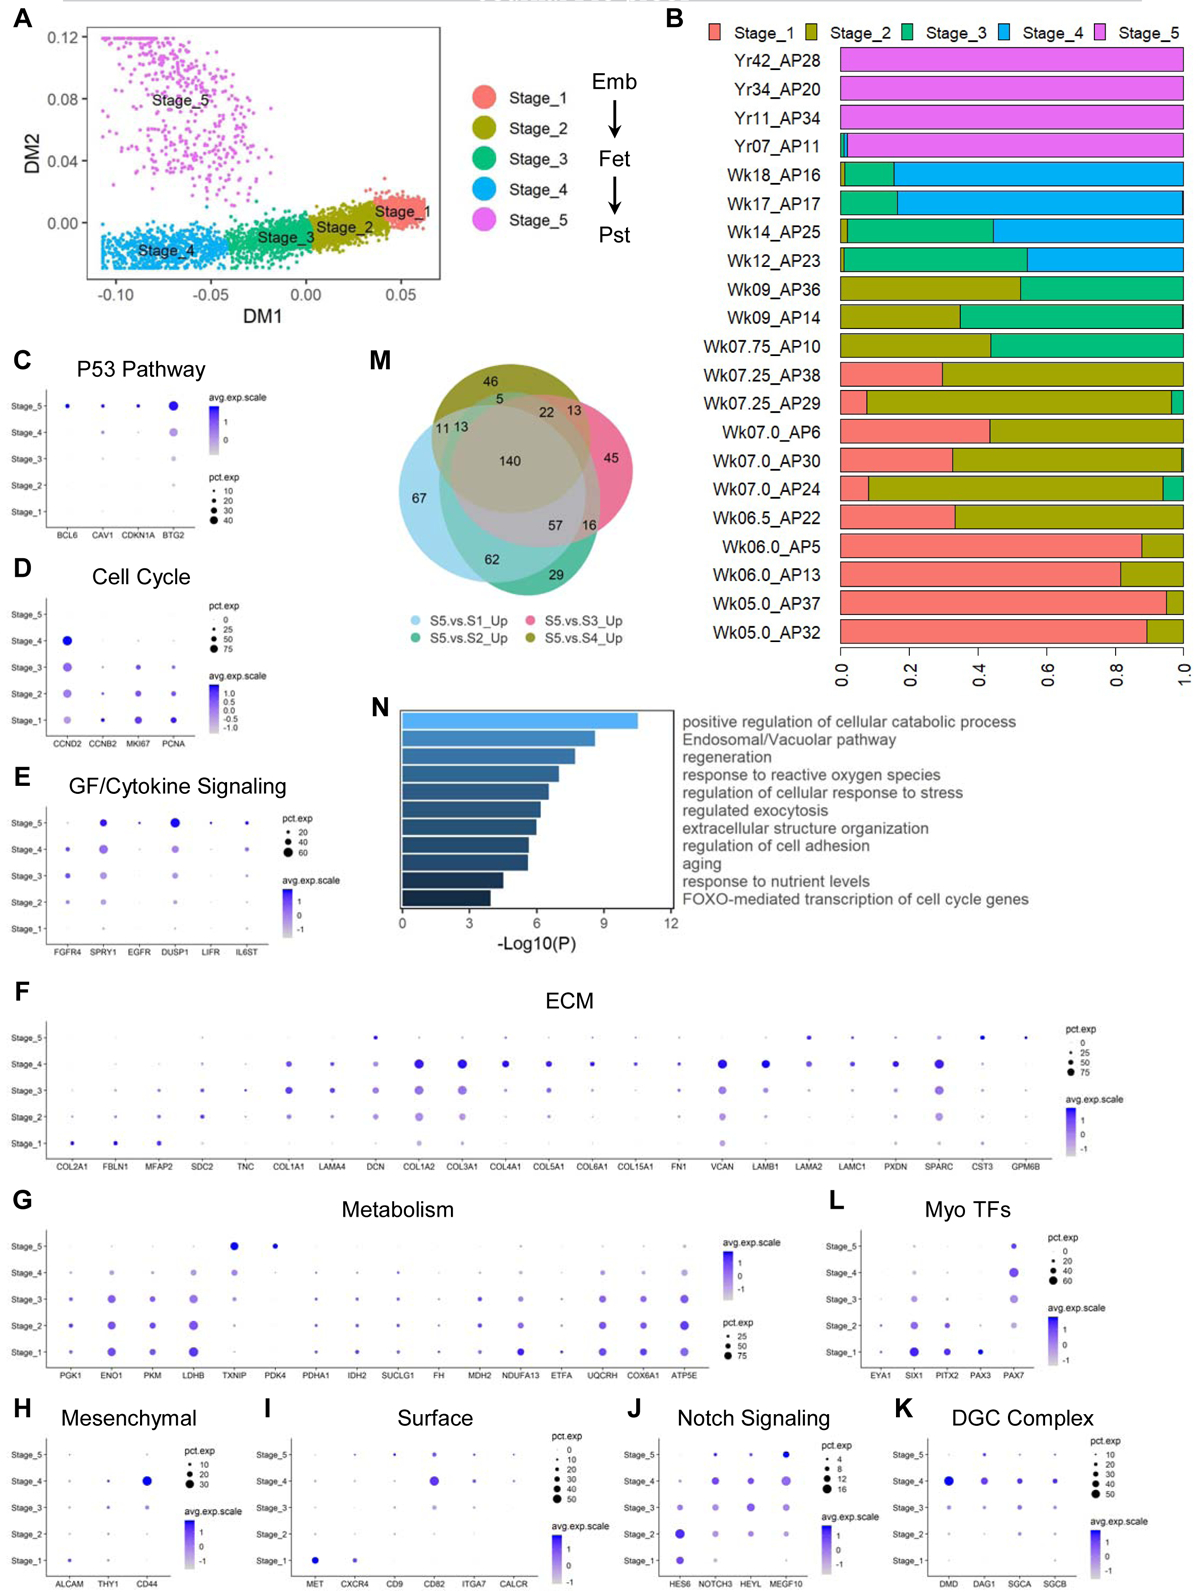
Figure 4. Skeletal myogenic progenitor and stem cells display dynamic gene expression signatures across human development. See also Figure S3.

(A) DM plot of single cells of in vivo SMPCs and SCs computationally clustered into 5 major stages. (B) Proportions of cells from each biological sample assigned to each computational stage. (C-L) Dot plots of selected markers for each labelled category. Pst, postnatal (including juvenile and adult). (M) Venn diagram of upregulated genes in stage 5 SCs compared to each stage of SMPCs from stage 1–4. (N) Selected enriched pathways from the 140 genes (M) commonly upregulated in SCs compared to each stage of SMPCs.
