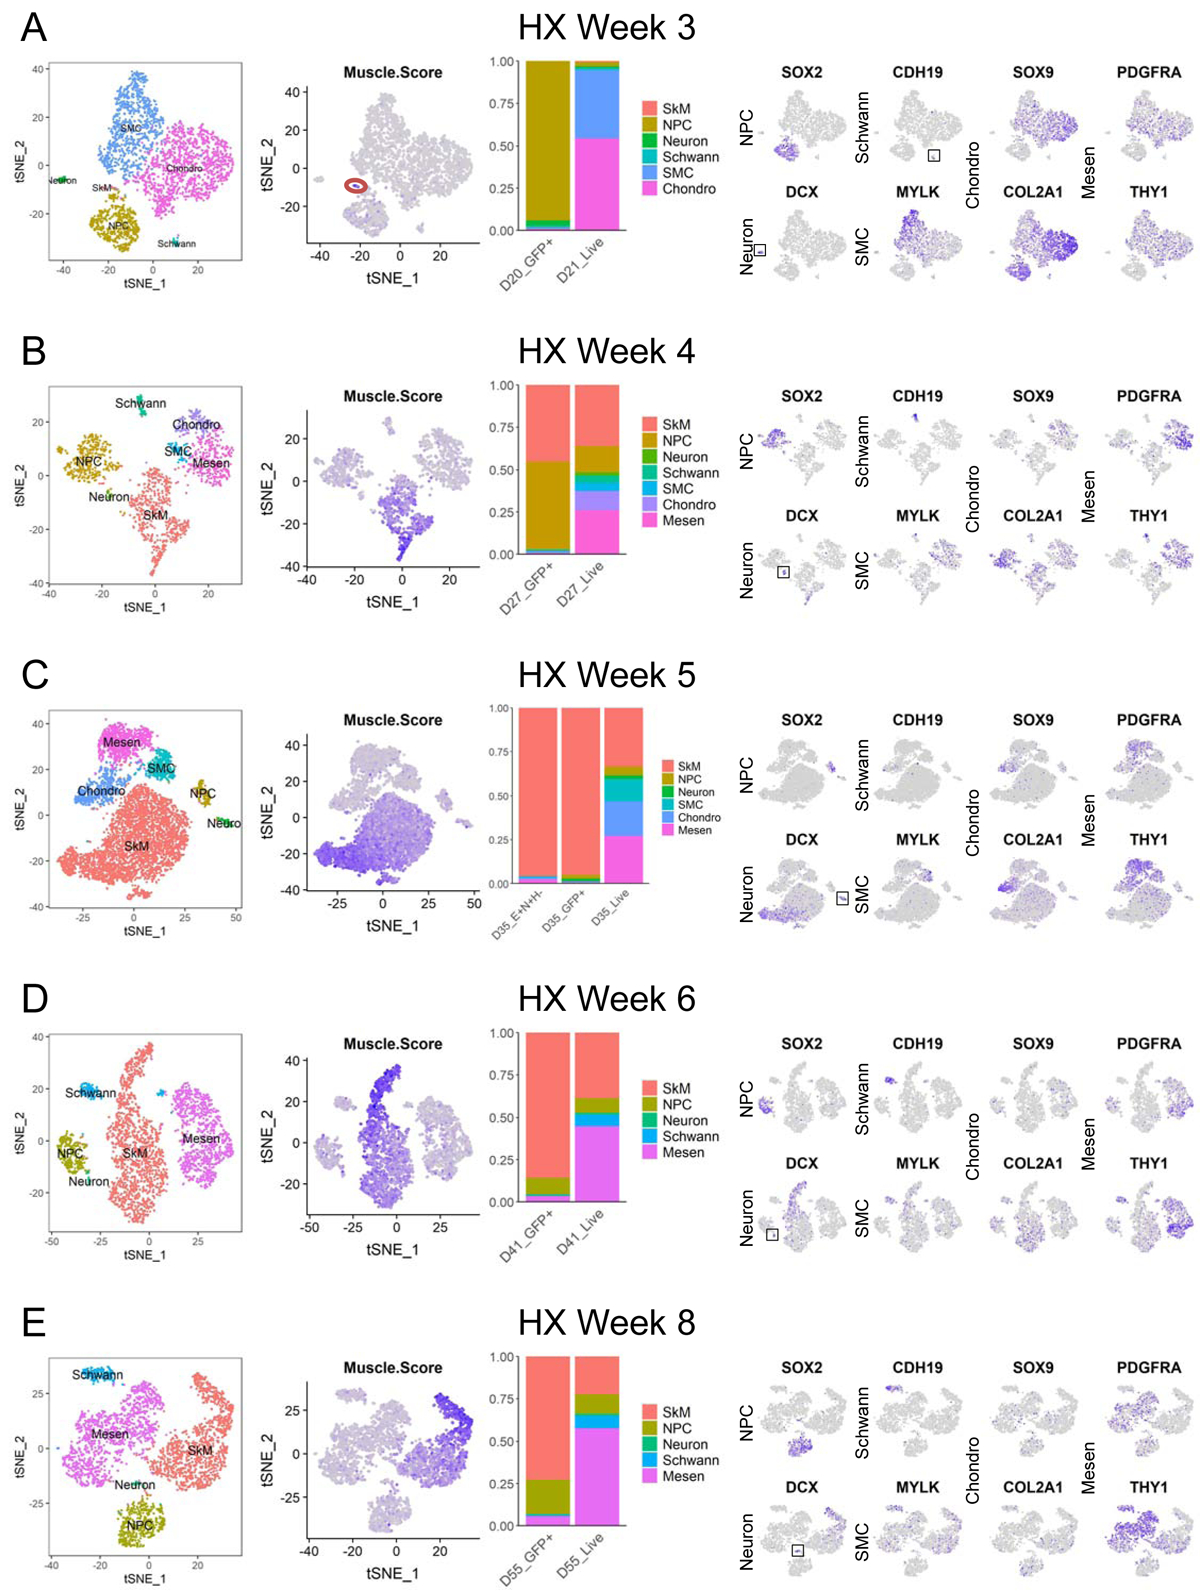
Figure 5. scRNA-seq identifies skeletal myogenic populations as well as other cell types during hPSC differentiation. See also Figures S4 and S5.

(A-E) From left to right. First panels: single cells from hPSC-derived samples using HX protocol grouped by differentiation time on tSNE plots and colored by cell type. Second panels: tSNE plots showing color-scaled “Muscle.Score” (purple-to-gray: high-to-low expression). The tiny SkM population at week 3 is red-circled. Third panels: bar plots of cell type distribution in enriched or unenriched samples at similar differentiation time points. Fourth panels: tSNE plots of selected cell type markers (purple-to-gray: high-to-low expression). Small populations are boxed for easy visualization.
