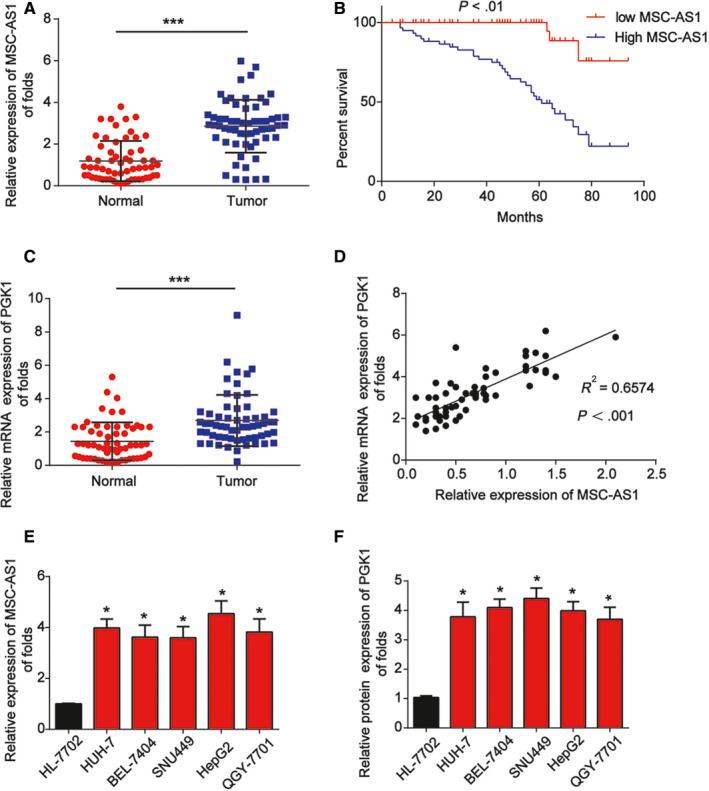
Figure 1.

Expression of MSC‐AS1 and PGK1 in HCC specimens. A, MSC‐AS1 expression in HCC tissues compared with paired noncancerous tissues (n = 60). B, Kaplan‐Meier analysis of progression‐free survival based on MSC‐AS1 levels in 60 HCC patients. C, PGK1 mRNA expression in HCC tissues compared with paired noncancerous tissues (n = 60). D, Correlation between expression of MSC‐AS1 and PGK1 in tissue specimens. E, MSC‐AS1 expression in HUH‐7, BEL‐7404, SNU449, HepG2, QGY‐7701, and HL‐7702 cells. F, PGK1 mRNA in HUH‐7, BEL‐7404, SNU449, HepG2, QGY‐7701, and HL‐7702 cells. Three independent experiments were carried out. Error bars stand for the mean ± SD of at least triplicate experiments. ***P < .001
