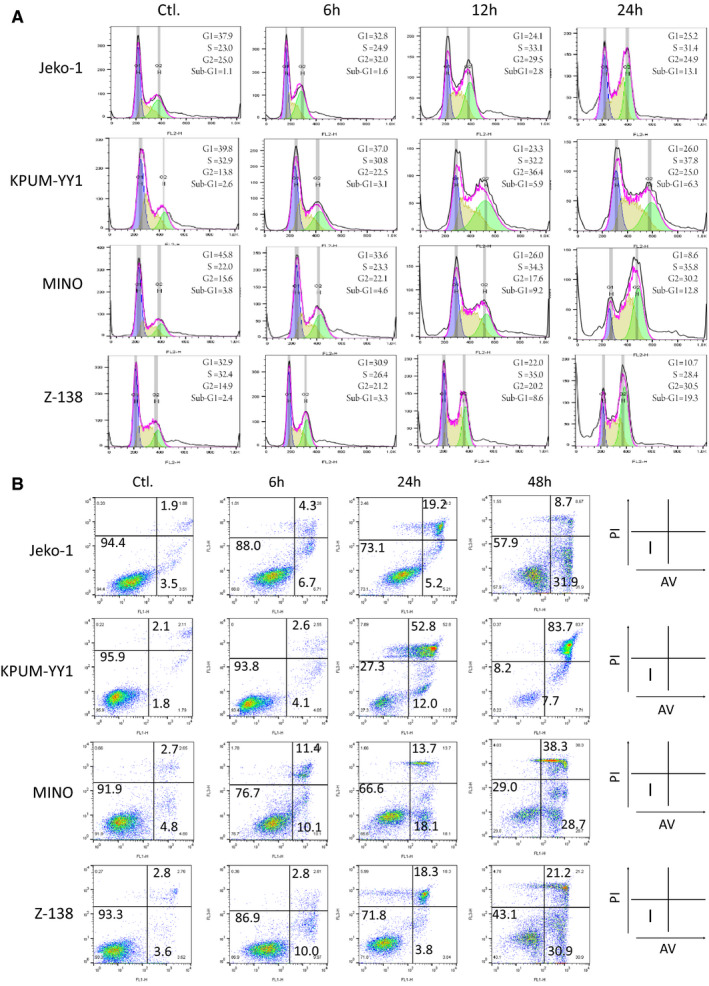
FIGURE 4.

Cellular effects of treatment of BI‐D1870‐sensitive MCL‐derived cell lines with BI‐D1870. Jeko‐1, KPUM‐YY1, MINO, and Z‐138 cells were treated with BI‐D1870 at IC80 concentrations for the indicated periods and then subjected to (A) cell cycle analysis by measurement of DNA content, and (B) apoptosis analysis by counterstaining with Annexin‐V (AV) and propidium iodide (PI) using flow cytometry. The cell cycle distribution was calculated using FlowJo software ver. X (A). In (B), Fraction I: AV negative (−)/PI (−) viable cells; Fraction II: AV (+)/PI(−) cells undergoing early apoptosis; Fraction III: AV (+)/PI (+) cells undergoing late apoptosis. Cell ratios are shown by the numbers on fractions I, II and III
