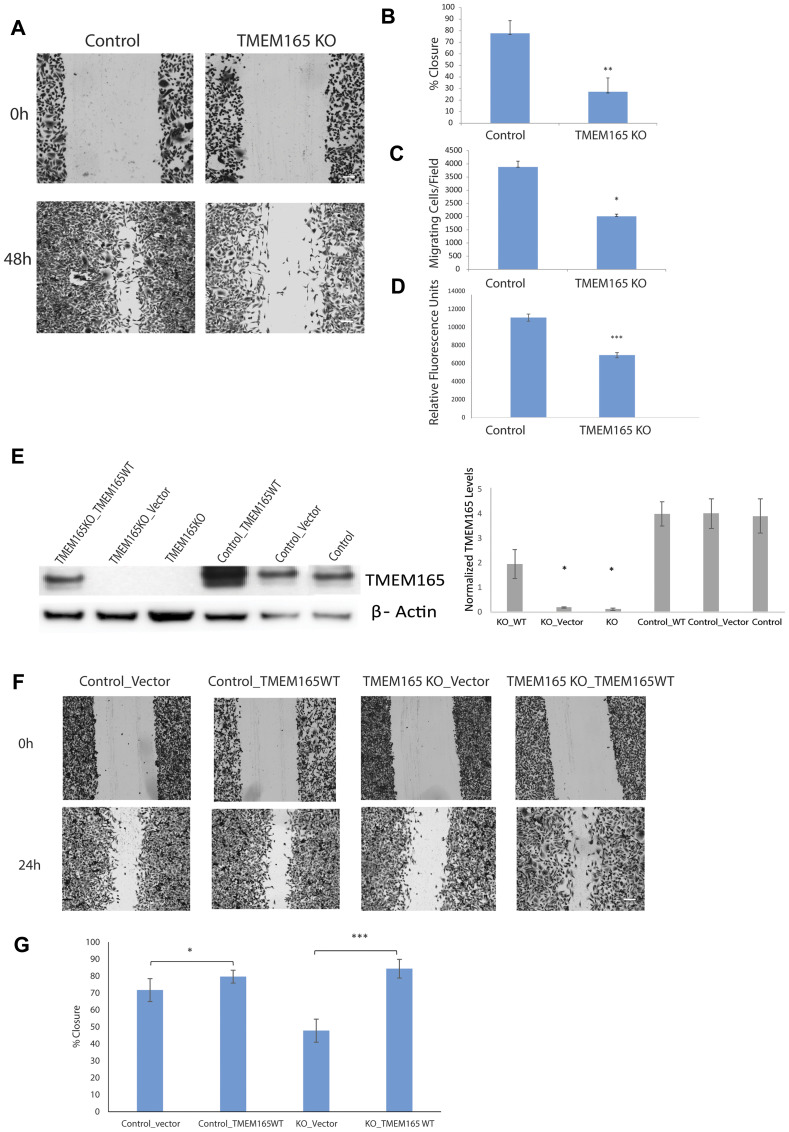
Figure 3. MDAMB231 TMEM165KO cells have reduced cell migration.
(A) Representative phase-contrast images of wound healing assays captured at 0 and 48 hr time points. Bar = 300 μm (B) Graphical representation of the percent closure from n = 3 wound healing experiments analyzed using ImageJ. Error bars denote SD; ** P < 0.001. (C) Boyden chamber transmigration data from n = 5 experiments showing the number of cells present on the lower compartment of a transwell membrane after 48 h. Error bars denote SD; * P < 0.05. (D) Chemicon (ECM554, Millipore, Billerica, MA) cell invasion assays were performed and cells that invaded ECM were measured using fluorescent plate reader, error bars denote SD of n = 3 experiments; *** P < 0.001. (E) Western blot analysis showing TMEM165 expression after transient transfection with TMEM165/GFP plasmid and vector in control and TMEM165KO cells. Right panel shows the quantification of TMEM165 protein levels after normalization with actin (n = 2, * P < 0.05). (F) Representative phase-contrast images show migration rescue in TMEM165KO after transfection with TMEM165/GFP plasmid compared to the control at the 0 and 24 hr time points. Bar = 300 μm (G) Graphical representation of wound healing rescue experiments n = 3 analyzed using Image J. Error bars denote SD; *** P < 0.000007 and * P < 0.05.

