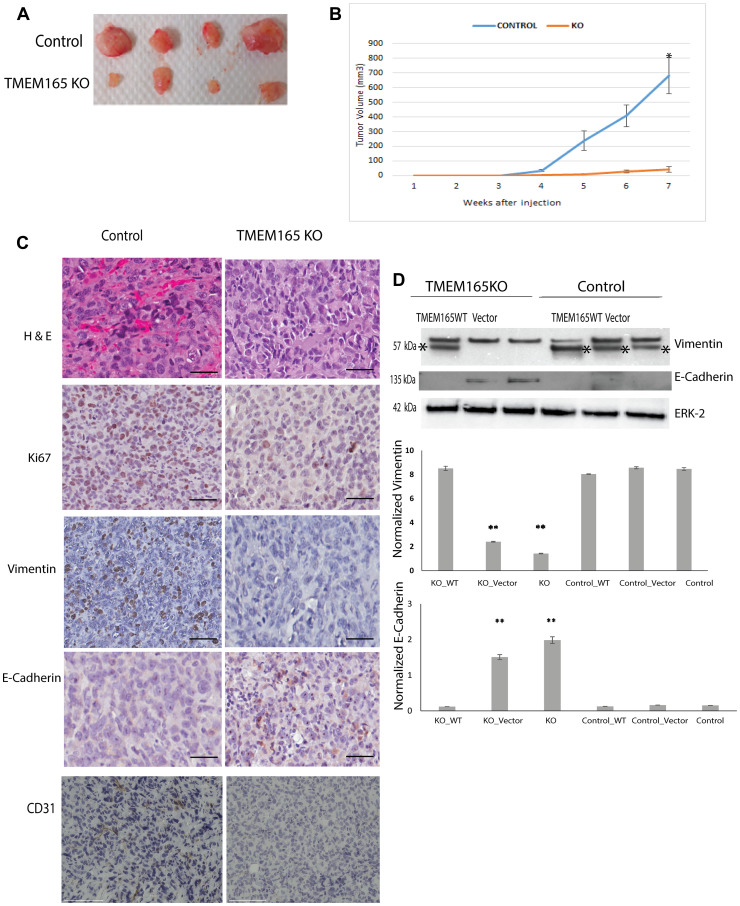
Figure 4. TMEM165 knockout inhibits breast cancer growth in a xenograft model.
(A) Representative image of tumors extracted from nude mice treated with MDAMB231 Control and MDA MB231 TMEM165KO. (B) Cumulative growth curves for MDAMB231 control cells and MDAMB231 TMEM165KO cell xenografts (n = 10 mice control, n = 10 TMEM165KO; * P < 0.0001). (C) Representative images of MDAMB231 Control and TMEM165KO derived tumor sections stained for Hematoxylin and eosin (H&E), Ki67, Vimentin, E-Cadherin, and CD31, bars 100 μm. (D) Western blot analysis of vimentin and E-cadherin expression after transient transfection with TMEM165/GFP or vector in TMEM165KO and control cells, asterisks mark the vimentin band in Western blots. Lower panels shows the quantification of Vimentin and E-cadherin protein levels after normalization with ERK (n = 2, ** P < 0.01). The Western blot images are cropped and were imaged with Bio-Rad EZ Imager. The second band from the left on the ERK Western blot has a slight air bubble just above the ERK band that does not impair quantitation.

