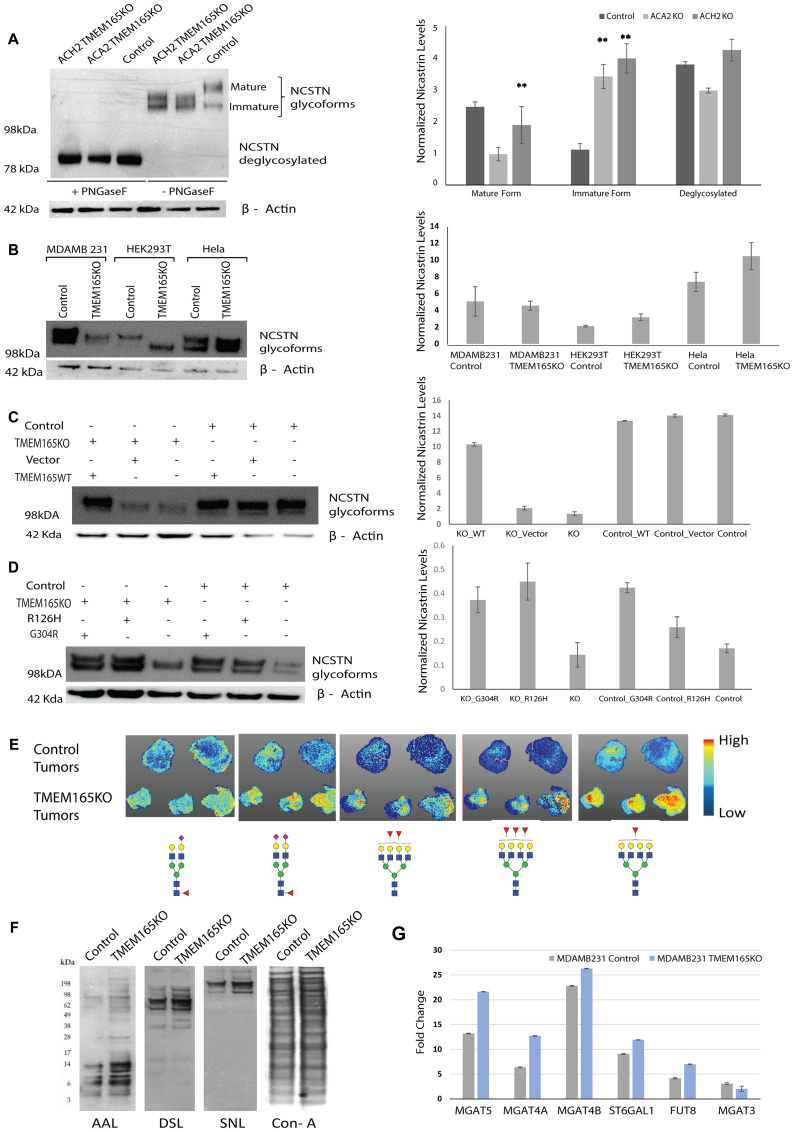
Figure 5. TMEM165 expression levels alters N-linked glycosylation.
(A) Western blot analysis of NCSTN from MDAMB231 TMEM165KO (clones ACH2 and ACA2) and MDAMB231 Control (clone ACH11) cell lysates before and after PNGaseF treatment. NCSTN mature, immature, and deglycosylated bands are labeled. The Western blot was imaged on Bio-Rad EZ Imager and has not been manipulated. Any marks on the blot that are not labeled bands are from forceps handling of the membrane. Right panel shows the quantification of mature, immature and deglycosylated forms Nicastrin protein levels after normalization with actin (n = 2, ** P < 0.01) (B) Western blot showing different glycoforms of NCSTN in Control and TMEM165KO across different cell lines (MDAMB231, HEK293T and Hela). NCSTN in Control and TMEM165KO across different cell lines (MDAMB231, HEK293T and Hela). Right panel shows the quantification of Nicastrin protein levels after normalization with actin (n = 2). (C, D) Western blot showing rescue of NCSTN glycoforms in TMEM165KO cells after transient transfection with TMEM16WT plasmid and TMEM165CDG mutants (R126H and G304R). Right panel shows the quantification of Nicastrin protein levels after normalization with actin (n = 2,** P < 0.01). (E) Xenograft paraffin embedded tissue sections treated with PNGaseF were subjected to Tissue MALDI-FTICR IMS exhibited differential expression of N-glycan structures among Control and TMEM165KO tumor tissues. Represented glycan structures are in accordance with the guidelines for the Consortium for Functional Glycomics (CFG): blue square, N-acetylglucosamine (GlcNAc); green circle, mannose (Man); yellow circle, galactose (Gal); red triangle, fucose (Fuc); purple diamond, N-acetylneuraminic acid (Neu5Ac). (F) Lectin blot analysis of MDAMB231 control and TMEM165KO cell lysates. (G) Graph representing the relative transcript levels of MGAT5, MGAT4A, MGAT4B, ST6GAL1, FUT8 and MGAT3 in MDAMB231 control or TMEM165KO cells. Normalized data expressed as fold change are plotted for each gene assayed. Error bars represent one standard deviation from the mean of triplicate values from n = 3 experiments.

