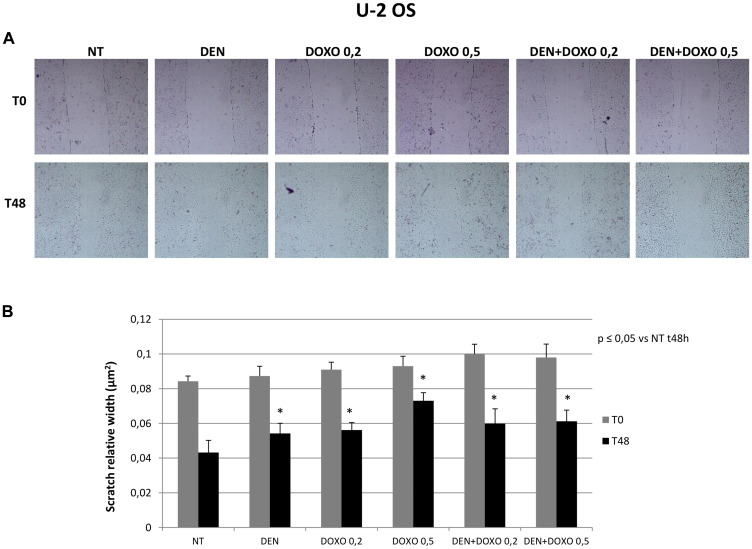
Figure 4. Invasive capacity evaluation in U-2 OS cells after treatment with Den and Doxo (scratch assay).
(A) U-2 OS cells have been plated in a six well plate and a single scratch has been performed in the center of the wells at the confluence of 70–80%. Cells have been treated with Den [30 μg/mL] and Doxo [0,2/0,5 μM] alone or in combination for 48 h. The representative images, taken at T0 and T48 h, of scratch relative width (nm2) are displayed. Images were taken on a AE2000 inverted microscope at 4× magnification. (B) The Histogram displays the relative quantification of the scratch width (nm2) after 24 h treatment with Den [30 μg/mL] and Doxo [0,2/0,5 μM] alone or in combination, compared with the initial width area measured with Motic images plus 2.0 Software. Data derived from three different assays. A One-way analysis of variance (ANOVA), followed by Tukey’s post hoc test, has been used to evaluate the statistical differences among groups. *indicates p ≤ 0.05 compared to the untreated control (NT).

