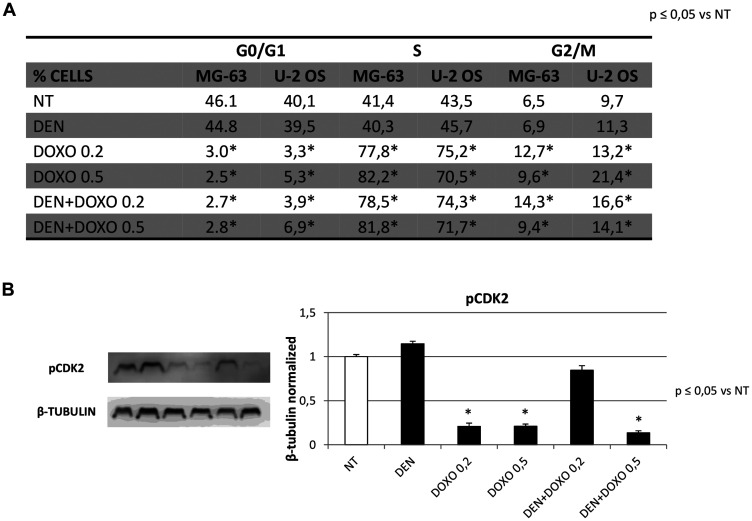
Figure 6. Cell Cycle progression in OS Cell lines before and after treatment with Den and Doxo by cytofluorimetric assay and Western Blotting (pCDK2).
(A) Percentage of MG63 cells and U-2 OS cells at different phases of the cell cycle (G0/G1 phase, S phase and G2/M phase) after treatments with Den [30 ug/mL] and Doxo [0,2/0,5 μM] alone or in combination, for 48 h. Cells were harvested, fixed, incubated with Muse Cell Cycle reagents and analyzed on “MUSE Cell Analyzer”. (B) pCDK2 protein expression levels in OS cells were determined by Western Blot, starting from 15 mg of total lysates after 48 h of exposure to Den [30 ug/mL] and Doxo [0,2/0,5 μM] alone or in combination. The most representative images are displayed. The proteins were detected using Image Studio Digit software and the intensity ratios of immunoblots, compared to that of untreated control (NT), taken as 1 (arbitrary unit), were quantified after normalizing with respective loading controls for the housekeeping protein β-Tubulin. Histogram shows the relative quantification for pCDK2 expression as the mean ± S. D. from three experiments. A One-way analysis of variance (ANOVA), followed by Tukey’s post hoc test, has been used to evaluate the statistical differences among groups. *indicates p ≤ 0.05 compared to the untreated control (NT).

