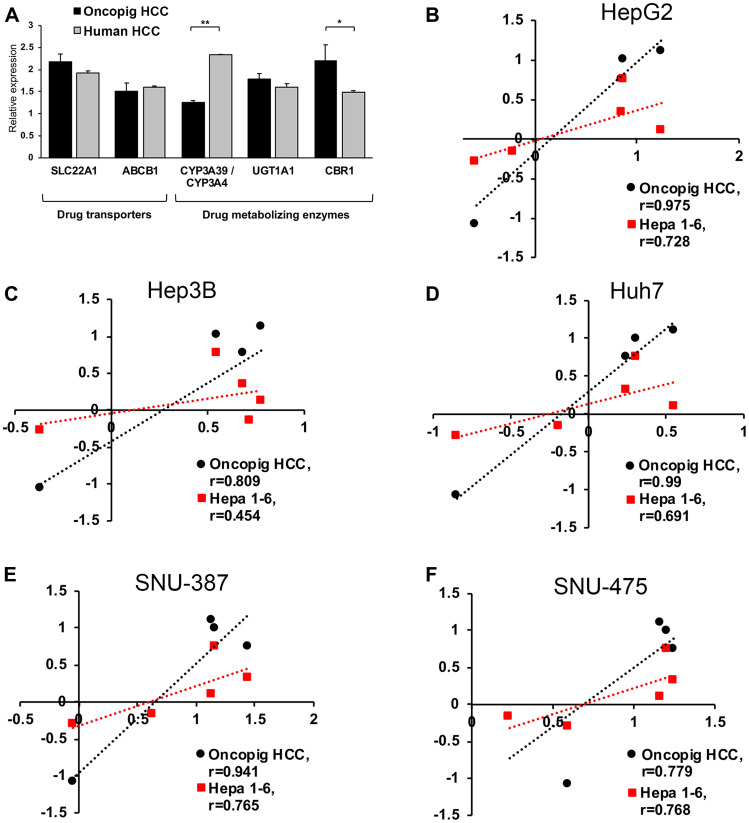
Figure 2. Oncopig, human, and murine HCC in vitro chemotherapeutic susceptibility.
(A) Gene expression levels in Oncopig (n = 3 cell lines) and human HCC cells (HepG2, Huh7, and Hep3B). (B–F) Correlation analysis of logIC50 values demonstrating more similar in vitro chemotherapeutic responses between Oncopig and human compared to murine Hepa1-6 and human HCC cells. Chemotherapeutic response of each HCC cell line towards sorafenib, doxorubicin, cisplatin, mitomycin C, and 5-FU was determined. Pearson correlation between logIC50 in Oncopig HCC cells or murine Hepa1-6 cells and the following human HCC cells was analyzed: (B) HepG2, (C) Hep3B, (D) Huh7, (E) SNU-387, and (F) SNU-475. *denotes P < 0.05, **denotes P ≤ 0.001.

