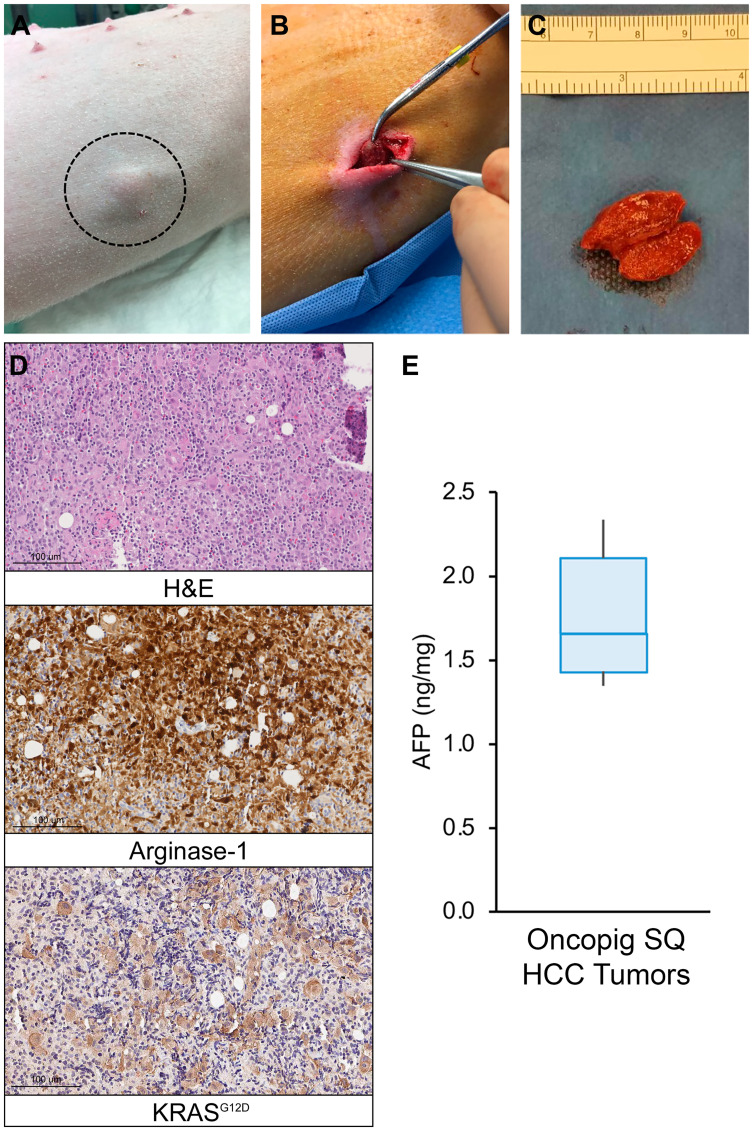
Figure 4. Oncopig SQ HCC autograft formation.
(A) Photograph of visible SQ HCC tumor (circled) in Oncopig flank. (B) Excision of 2.0 cm SQ HCC tumor. (C) Excised and transected SQ HCC tumor. (D) H & E (20×) of Oncopig SQ HCC tumor demonstrates prominent, dispersed, pleomorphic large atypical cells, 5–10× the size of lymphocytes, flanking fibrous vascular septae, surrounded by dense mixed immune cell infiltrates. Arginase-1 IHC (20×) shows that these atypical cells show patchy arginase-1 expression (brown) consistent with hepatocellular differentiation. KRASG12D IHC (20×) confirms KRASG12D expression (brown) consistent with malignancy. (E) AFP expression across Oncopig SQ HCC tumors (n = 6).

