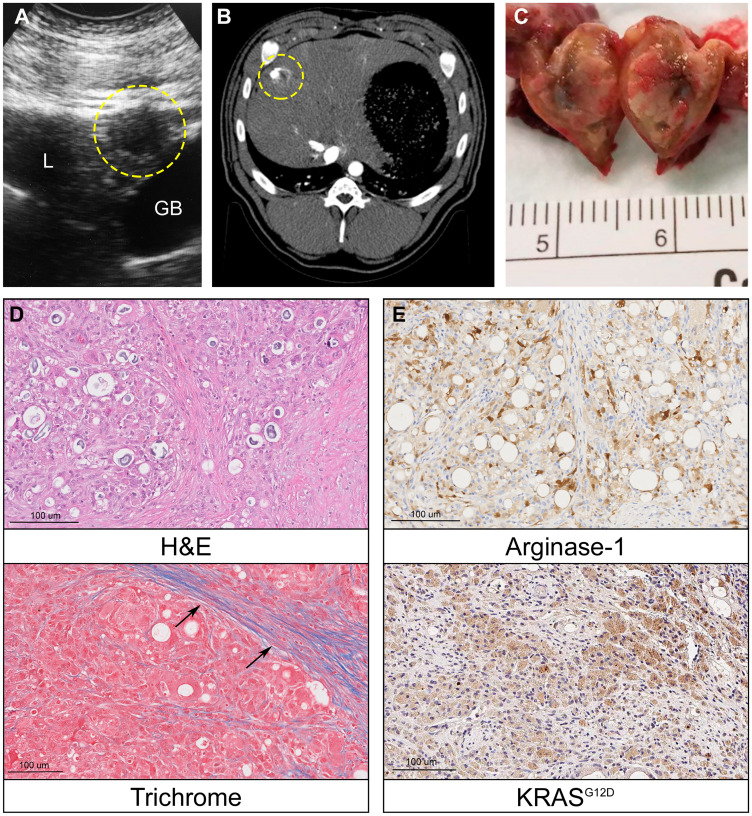
Figure 5. Oncopig intrahepatic HCC tumor formation.
(A) Liver ultrasound depicting a hypoechoic 1 cm round intrahepatic HCC tumor (circled, L = liver, GB = gallbladder). (B) Contrast enhanced liver CT depicts same HCC tumor (circled). (C) Photograph of transected intrahepatic HCC tumor. (D) H & E (20×) of Oncopig intrahepatic HCC tumor reveals architectural distortion characterized by expansion of liver cords, nuclear pleomorphism, anisonucleosis, and nodular fibrosis. Masson’s trichrome of adjacent non-tumorous liver demonstrates dense collagen bands (arrows) consistent with METAVIR grade 2-3 fibrosis. (E) Arginase-1 IHC (20×) shows patchy arginase-1 expression (brown) consistent with hepatocellular differentiation. KRASG12D IHC (20×) confirms KRASG12D expression (brown) consistent with malignancy.

