. 2020 May 14;9:e56582. doi: 10.7554/eLife.56582

Figure 5. Assemblies based on centromeric nucleosomes form load-bearing microtubule attachments through OA or Mif2 or both.

(A) Percentages of free beads that bound microtubules under no force. Error bars indicate the standard error of the sample proportion. Barnard’s test was used to compare contingency tables. n.s. indicates p>0.05. * indicates p<0.05. ** indicates p<0.01. (B) Boxplot of rupture forces observed with reconstituted kinetochores. Each shaded circle is an individual rupture event. Boxes extend from the lower quartile to the upper quartile. Whiskers extend to 1.5 times the interquartile range beyond each quartile. A Kolmogorov-Smirnov test was used to compare probability distributions and calculate p-values. n.s. indicates p>0.05. * indicates p<0.05. ** indicates p<0.01. (C) Survival curves for Cse4 NCP/OA/2D-MIND/Ndc80c linkages (yellow), Cse4 NCP/Mif2/2D-MIND/Ndc80c linkages (brown), and Cse4 NCP/OA/Mif2/2D-MIND/Ndc80c linkages (purple). Raw data of all rupture events are included in Figure 5—source data 1.

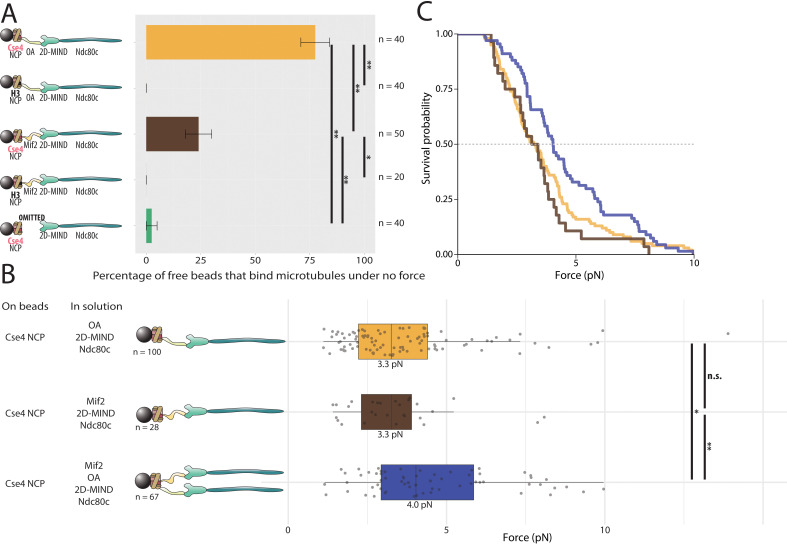
Figure 5—source data 1. Raw rupture force data for nucleosome core particle-based linkers.

Figure 5.

Figure 5—figure supplement 1. Load-bearing attachments between OA and Cse4-NCPs occur through the N-terminus of Cse4.

Figure 5—figure supplement 1.

(A) Boxplot of rupture forces observed with reconstituted kinetochores. Each shaded circle is an individual rupture event. Boxes extend from the lower quartile to the upper quartile. Whiskers extend to 1.5 times the interquartile range beyond each quartile. A Kolmogorov-Smirnov test was used to compare probability distributions and calculate p-values. * indicates p < 0.05. (B) Survival curves for Cse4-NCP/ OA/2D-MIND/Ndc80c linkages (yellow), Cse4(1-50)/OA/2D-MIND/Ndc80c linkages (green), and Cse4(1-50)/ Mif2/ OA/ 2D-MIND/Ndc80c linkages (pink). The dashed horizontal line indicates 50% survival (median rupture force). Raw data of all rupture events are included in Figure 5—source data 1.
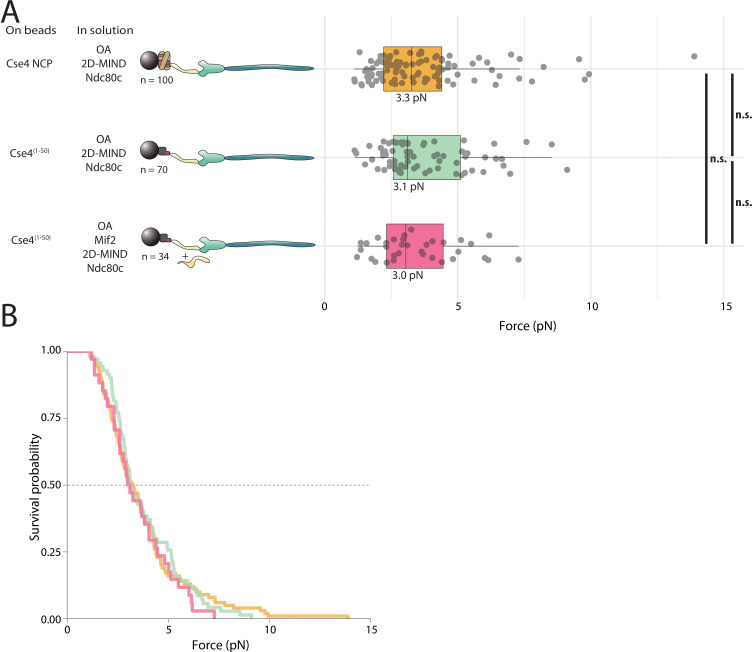
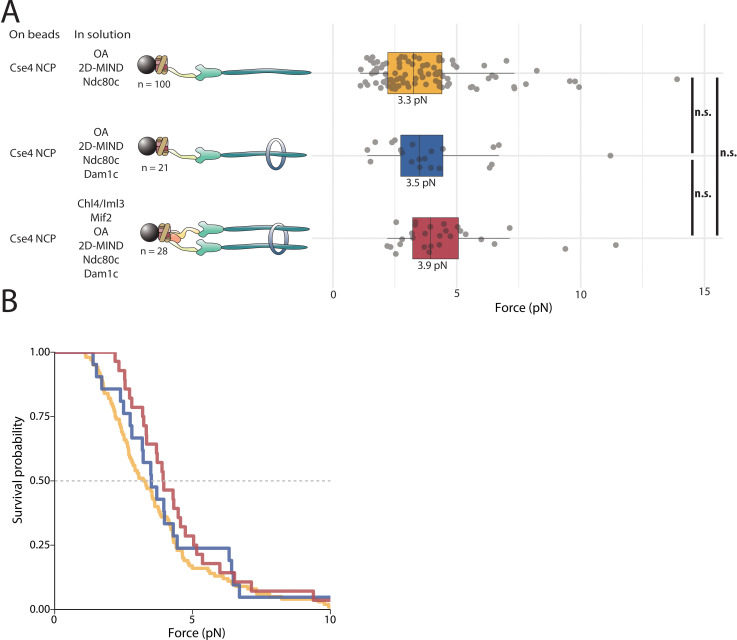
Figure 5—figure supplement 2. Neither Dam1c nor CI increases the rupture force of NCP-containing linkers.

Figure 5—figure supplement 2.

(A) Boxplot of rupture forces observed with reconstituted kinetochores. Each shaded circle is an individual rupture event. Boxes extend from the lower quartile to the upper quartile. Whiskers extend to 1.5 times the interquartile range beyond each quartile. A Kolmogorov-Smirnov test was used to compare probability distributions and calculate p-values. * indicates p < 0.05. (B) Survival curves for Cse4-NCP/ OA/2D-MIND/Ndc80c linkages (yellow), Cse4-NCP/OA/2D-MIND/Ndc80c/Dam1c linkages (blue), and Cse4-NCP/CI/ Mif2/ OA/ 2D-MIND/Ndc80c/Dam1c linkages (pink). The dashed horizontal line indicates 50% survival (median rupture force). Raw data of all rupture events are included in Figure 5—source data 1.