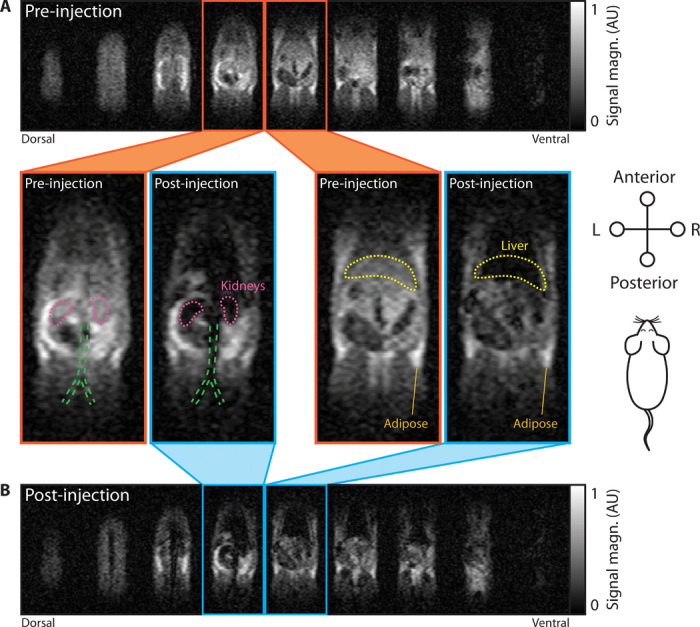
Fig. 2. In vivo imaging at 6.5 mT of SPION biodistribution in a rat model.

(A) MRI scan of rat anatomy before CA injection. (B) MRI scan of rat 30 min after a tail vein injection of HS-PEG SPIONs at 5 mg/kg. Both three-dimensional (3D) bSSFP MRI datasets were acquired in 12.5-min acquisitions with tip angle α = 90° and a 2.0 mm × 1.6 mm × 5.9 mm voxel size. The 9 signal-containing slices of 11-slice datasets are shown in (A) and (B). Attention is drawn to the two central slices from the pre-injection dataset (orange outline) and post-injection dataset (blue outline). Outlines of the kidneys (pink), liver (yellow), and the bifurcation of the aorta and inferior vena cava (green) are provided for discussion in the main text. Field of view (FOV) in each slice is 155 mm × 73 mm. AU, arbitrary units.
