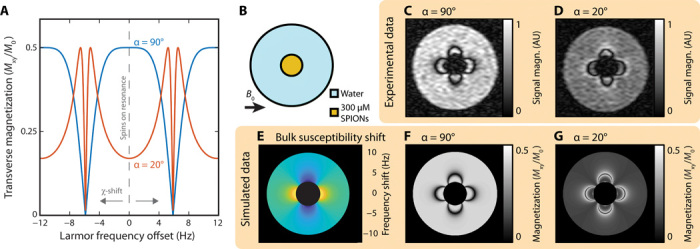
Fig. 3. Susceptibility-based contrast at ultra-low magnetic fields.

(A) Simulated transverse magnetization of spins during bSSFP imaging. MRI signal magnitude is proportional to the transverse magnetization (Mxy) of 1H nuclear spins, which is shown here as a function of frequency offset (the difference between RF pulse frequency and Larmor precession frequency). Spins not in the presence of SPIONs have zero Larmor frequency offset. As SPION concentration increases, nearby spins experience a susceptibility (χ) shift in Larmor frequency. Curves for RF pulse tip angles of α = 20° (red) and α = 90° (blue) are shown. The transverse magnetization is normalized by the fully relaxed longitudinal magnetization (M0). TR = 85 ms and T1/T2 = 1 in this model. (B) Phantom schematic. A small vial of HS-SPIONs at 300 μM (orange) is suspended in a larger vial of water (blue). The 6.5-mT static magnetic field of the scanner (B0) is oriented perpendicular to the cylindrical vial axis. (C) Standard bSSFP MRI of the phantom shown in (B), acquired at 6.5 mT with a tip angle α = 90°. (D) Small tip angle bSSFP MRI of the same phantom, acquired with α = 20°. (E) Analytical calculation of the 1H Larmor frequency shift expected in the water region of the phantom in (A) due to bulk magnetization of the adjacent SPION vial. (F) Signal magnitude predicted in a bSSFP MRI of 1H spins shifted by frequencies depicted in (E) when α = 90°. (G) Signal magnitude predicted in a bSSFP MRI of 1H spins shifted by frequencies depicted in (E) when α = 20°. Simulation data for the SPION vial are blacked out in (E) and (F) as well as (G) as a key assumption of the bSSFP trajectory model, that TR ≪ T2, does not hold in this region of the images. FOV in all images is 49 mm. The α = 90° and α = 20° images were acquired with 6.2- and 12.4-min scans, respectively.
