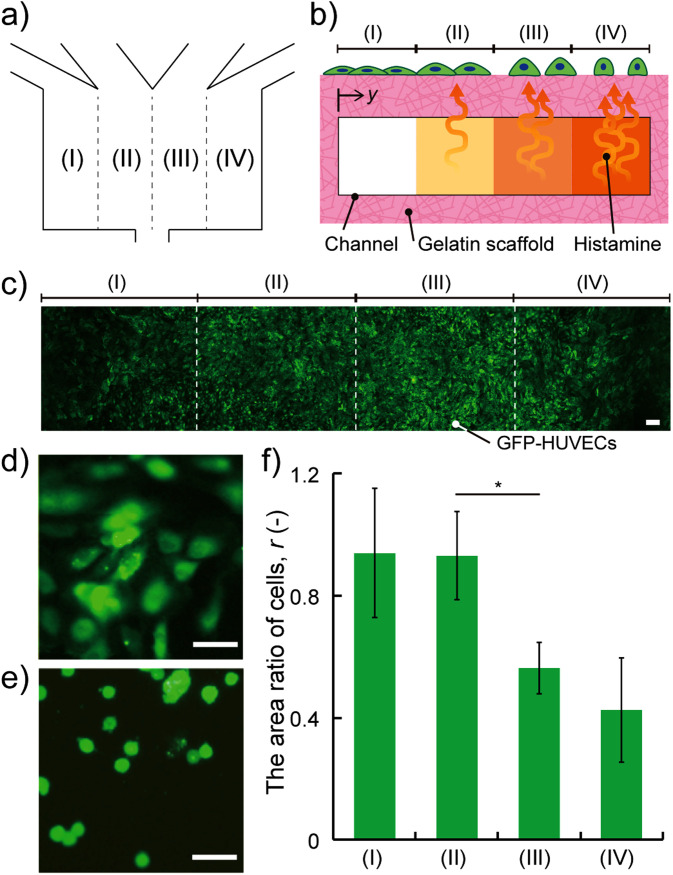
FIG. 4.
HUVECs cultured on the surface of the device respond to histamine with a concentration gradient driven by the interstitial flow. (a) Schematic of four areas in the culture area. (b) Cross-sectional view of the four areas: (I) (y = 0–1.25 mm), (II) (y = 1.25–2.5 mm), (III) (y = 2.5–3.75 mm), and (IV) (y = 3.75–5.0 mm). (c) Fluorescent image of GFP-HUVECs cultured on the area. (d) and (e) GFP-HUVECs (green) at the area (IV) shrunk before and after introducing medium with histamine at 2 h (scale bars = 50 μm). (f) The area ratio of cells at (I)–(IV) after histamine exposure. The data were presented as mean ± SD. *p < 0.01 by Student's t-test (n = 6).

