
Figure 10.
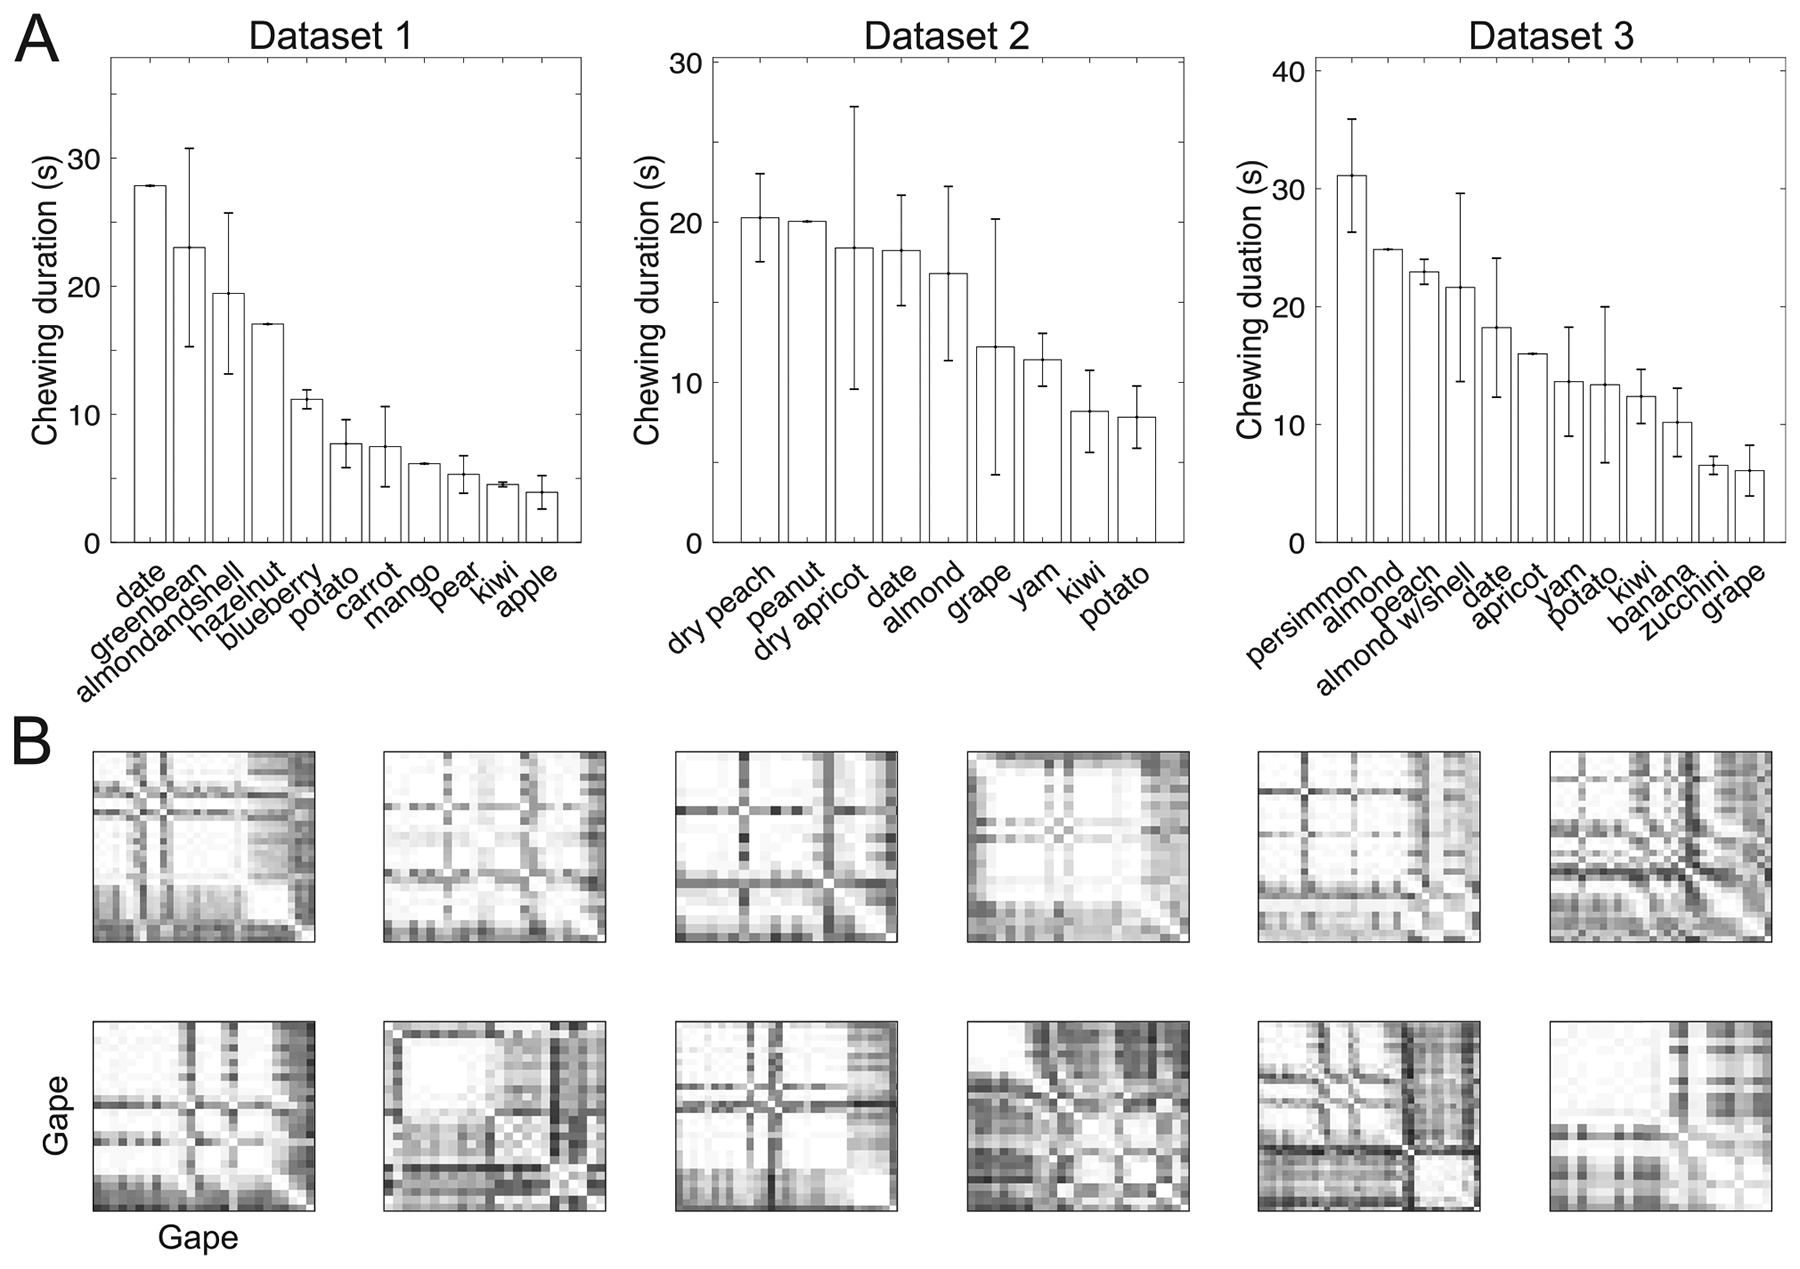
Variability in chewing of inter- and intra-food. (A) Duration of chewing gapes among all food types in each dataset. (B) Illustration of dissimilarity of chewing dynamics for the same food (kiwi) at multiple single trials (Dataset 3). Each matrix shows the dissimilarity (mean divergence measure) percentile of all chewing gapes within a single trial.