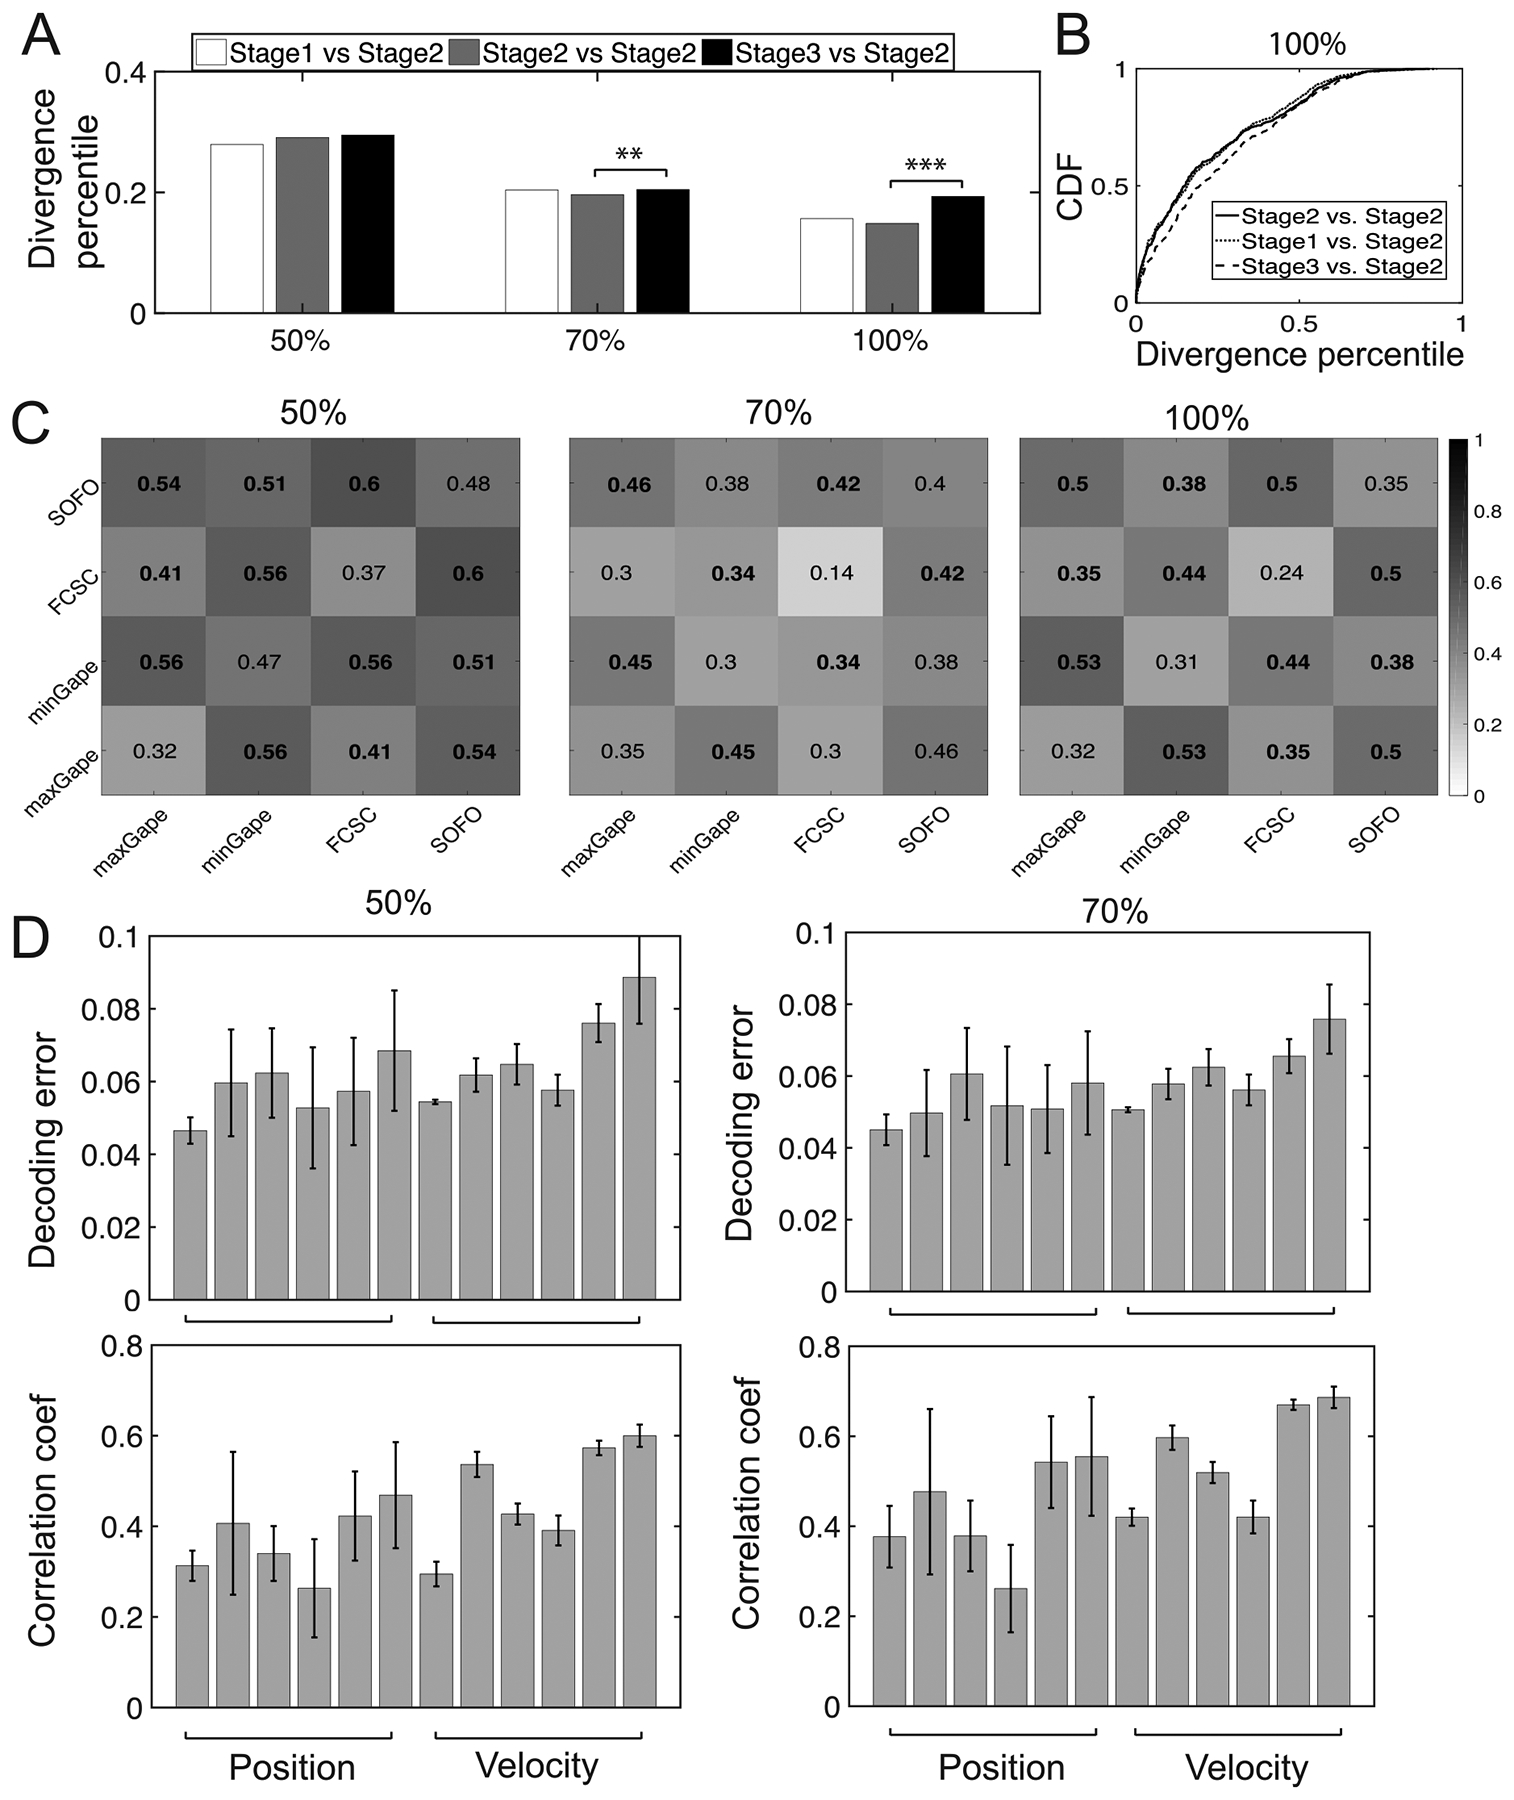
Figure 15.

Result robustness with respect to cell sampling percentages 50%, 70% and 100% (Monkey O, Dataset 1). (A) Comparison of median statistics of divergence percentile (rank-sum test: ** p < 0.01, *** p < 0.001) at stage-wise chewing periods. (B) Comparison of their CDF curves for the 100% condition. Two-sample KS test: 2–2 versus 1–2, p = 0.03; 2–2 versus 3–2, p = 1.4 × 10⁻¹¹). (C) Comparison of four transitions between chewing phases derived from all food trials. Numbers indicate the median divergence percentile. Lower values in diagonal elements are common in three panels. Similar to figure 11(C), the values above the statistical significance threshold (with respect to off-diagonal divergence statistics) are marked in bold font. (C) Decoding error (similar to figure 14) based on subsampled cell populations.
