
Figure 4.
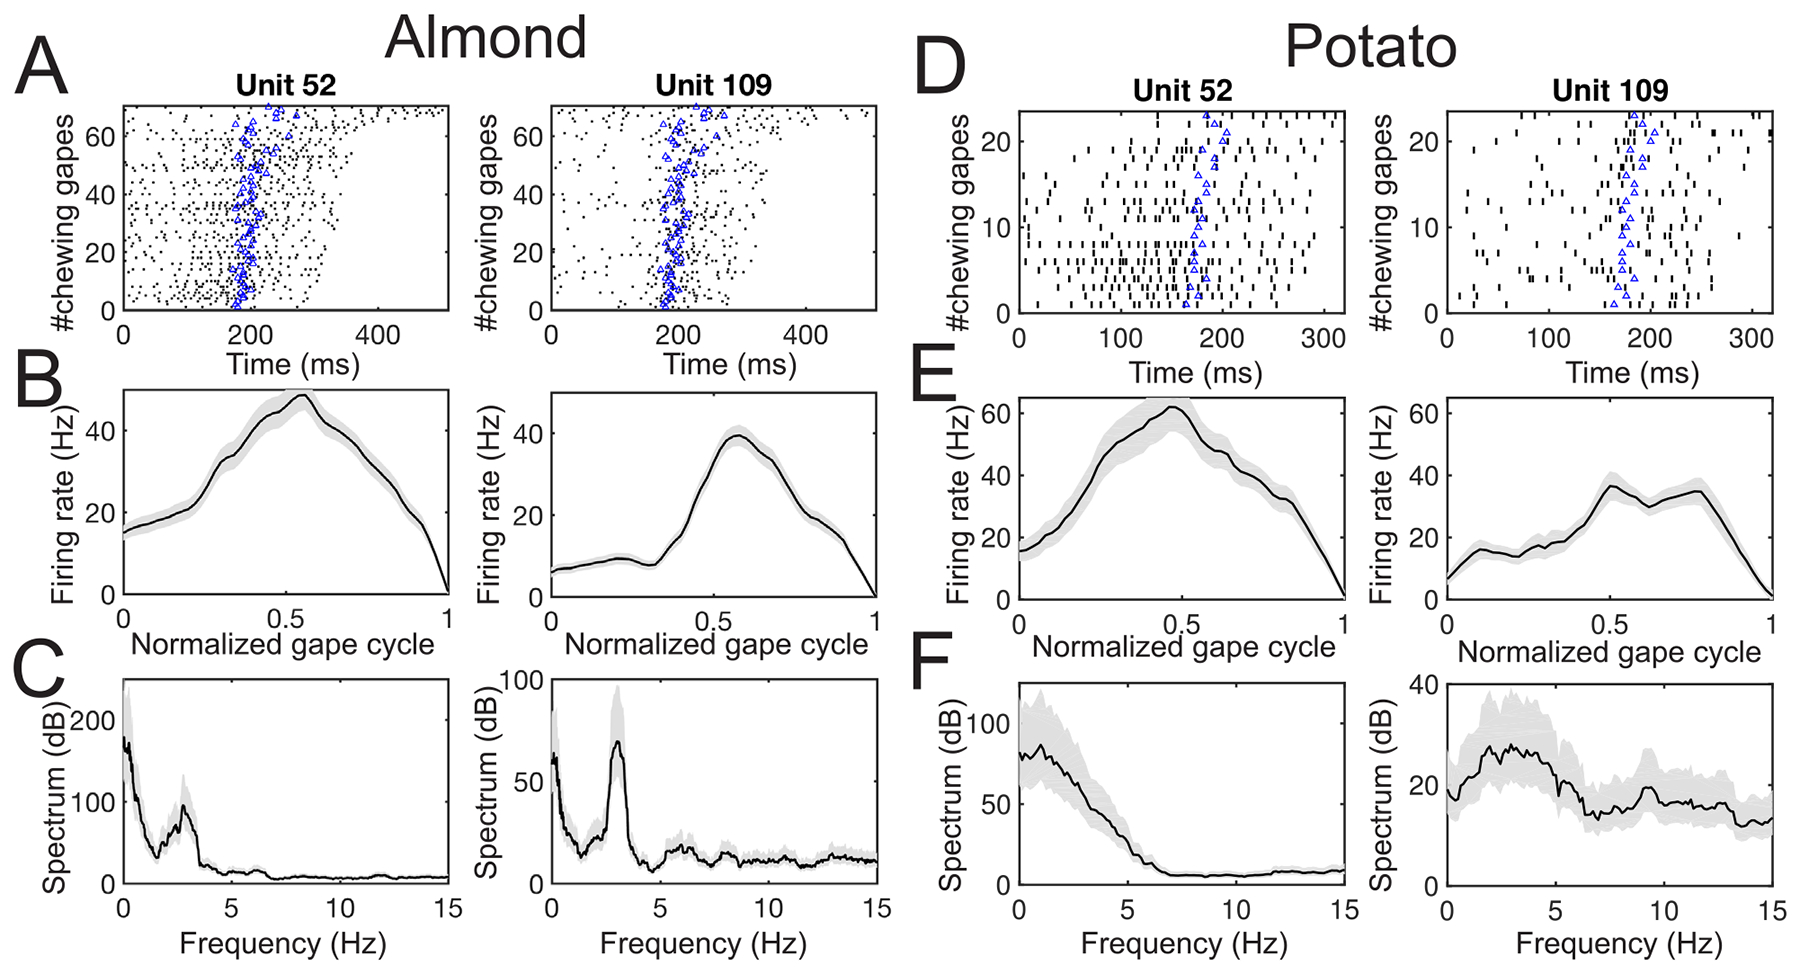
Characterization of two representative MIo single units (Monkey O, Dataset 1) in two single trials. (A) Spike rasters of all chewing gape cycles (from the maximum gape to the consecutive maximum gape) within a single almond trial. Each row corresponds to one gape cycle. The rasters are ordered bottom to top by increasing cycle duration. The blue triangle in each row marks the time where the minimum gape occurs in each gape cycle. (B) Tuning curve of chewing gape within a normalized gape cycle. Shaded area marks the SEM. (C) Spike spectrum. Shaded area marks the confidence interval. (D)–( F) Same as (A)–(C), except for potato-type trials. Note the lack or less stronger 3 Hz oscillation in both spike spectra in panel (F).