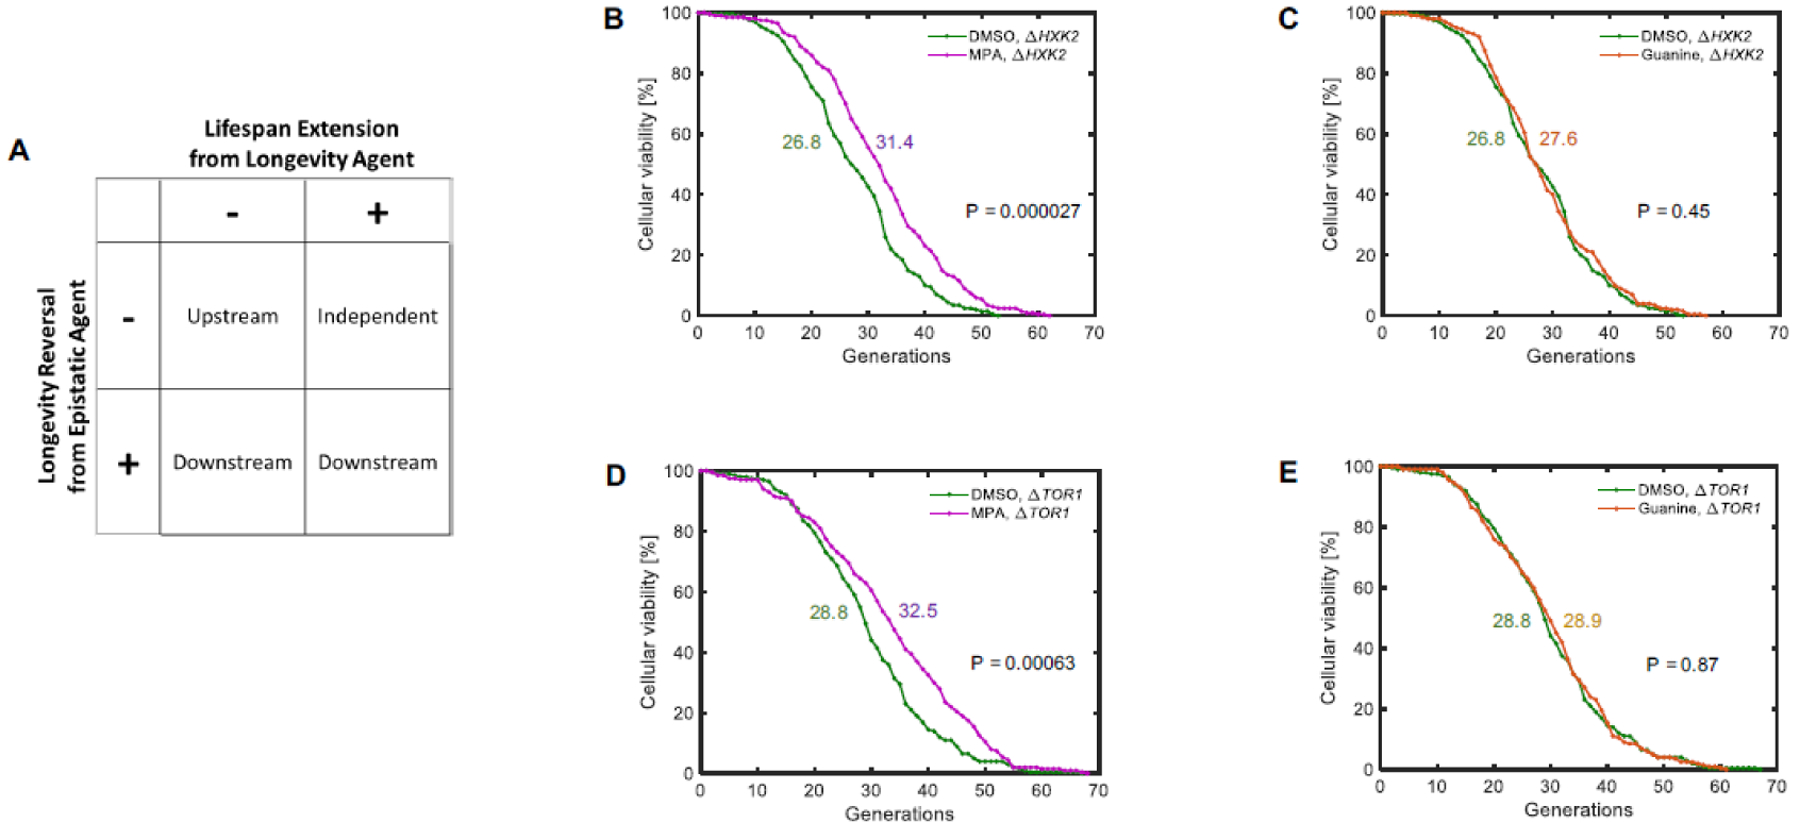
Figure 2. Inhibition of GMP synthesis extends lifespan independent of the nutrient sensing pathway.

A. Schematic representation of the LPT test and its interpretation. B-E. Lifespan curves corresponding to Step 1 (B, D) or Step 2 (C, E) of the LPT test for the nutrient sensing pathway, including a dietary restriction mimetic (B, C) and TOR inhibition (D, E). N = 200 cells for each condition, pooled from two or more independent experiments. Colored numbers next to the lifespan curves indicate the average replicative lifespan values corresponding to the lifespan curve matching its color.
