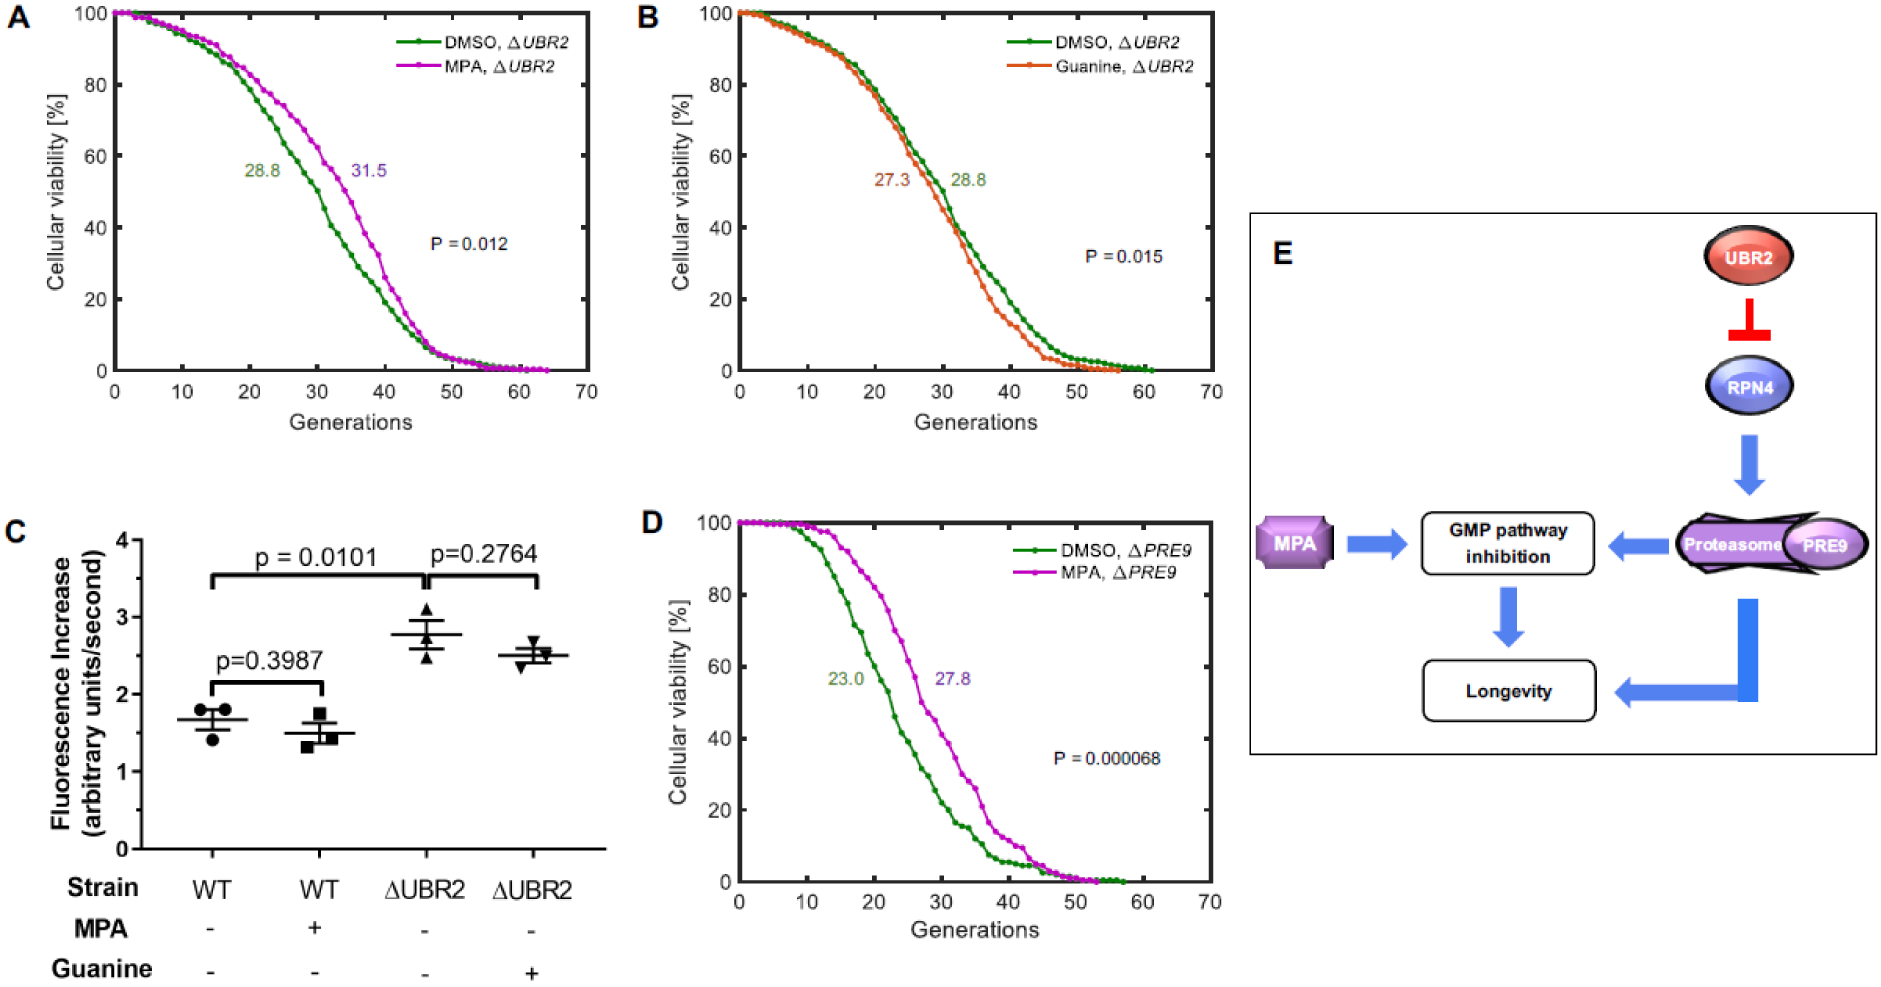
Figure 3. Proteasome activation extends lifespan in part through the GMP pathway.

A-B. Lifespan curves corresponding to Step 1 (A) and Step 2 (B) of the LPT test for the proteasome pathway of lifespan extension. N = 300 cells for the MPA condition, pooled from three independent experiments of 100 cells each; N = 400 cells for the DMSO condition, pooled from four independent experiments of 100 cells each; N = 400 cells for the guanine condition, pooled from four independent experiments of 100 cells each. C. Proteasome activity for wild-type (BY4741) cells, or ΔUBR2 cells, in the presence or absence of MPA or guanine. N = 3 biological replicates for each condition. Errors bars are standard error of the mean. D. Lifespan curve for a ΔPRE9 strain in the presence or absence of MPA. N = 200 cells for each condition, pooled from two independent experiments of 100 cells each. In (A, B, D), colored numbers next to the lifespan curves indicate the average replicative lifespan values corresponding to the lifespan curve matching its color. E. A schematic model presenting the relationship of longevity interactions described in this paper. The actions of MPA converge on the actions of the proteasome at the level of GMP pathway inhibition. Inhibition of GMP pathway extends lifespan. Proteasome activation also extends lifespan independently of GMP pathway inhibition.
