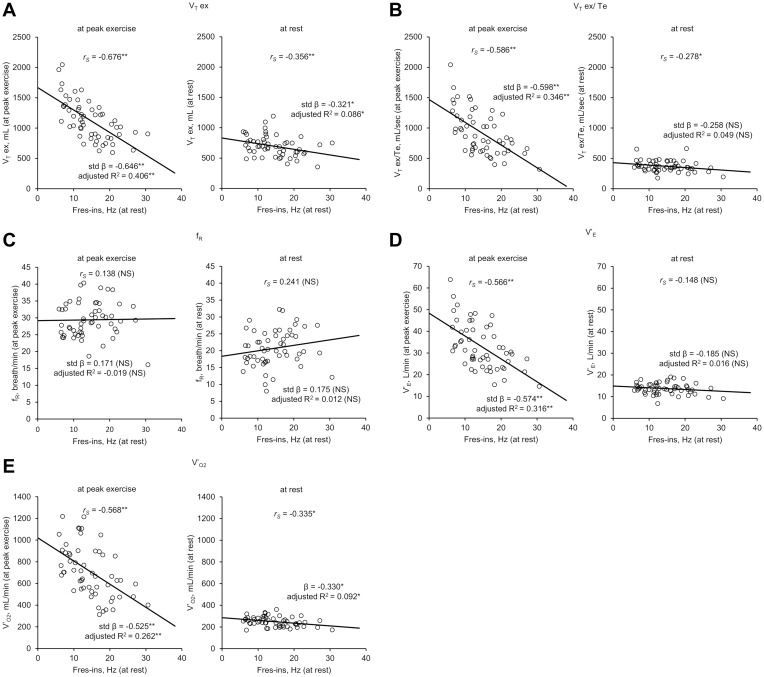
Figure 3.
Results of univariate analyses and Spearman’s rank correlation coefficient analyses between inspiratory resonant frequency (Fres-ins) at rest and ventilatory parameters of cardiopulmonary exercise testing (CPET) (n=55). In each figure, the graphs on the left show the results of Fres-ins at rest and CPET ventilatory parameters at peak exercise, while those on the right show the results of Fres-ins at rest and ventilatory parameters at rest, respectively. (A) Fres-ins and expiratory tidal volume (VT ex). (B) Fres-ins and mean expiratory flow (VT ex/Te). (C) Fres-ins and breathing frequency (fR). (D) Fres-ins and minute ventilation (V’E). (E) Fres-ins and oxygen uptake (V’O2). *p<0.05; **p<0.01.
Abbreviations: CPET, cardiopulmonary exercise testing; fR, breathing frequency; Fres-ins, inspiratory resonant frequency; NS, not significant; R2, R-squared; rS, Spearman’s rank correlation coefficient; std β, standardized regression coefficient estimate; V’E, minute ventilation; V’O2, oxygen uptake; VT ex, expiratory tidal volume; VT ex/Te, mean expiratory flow.

