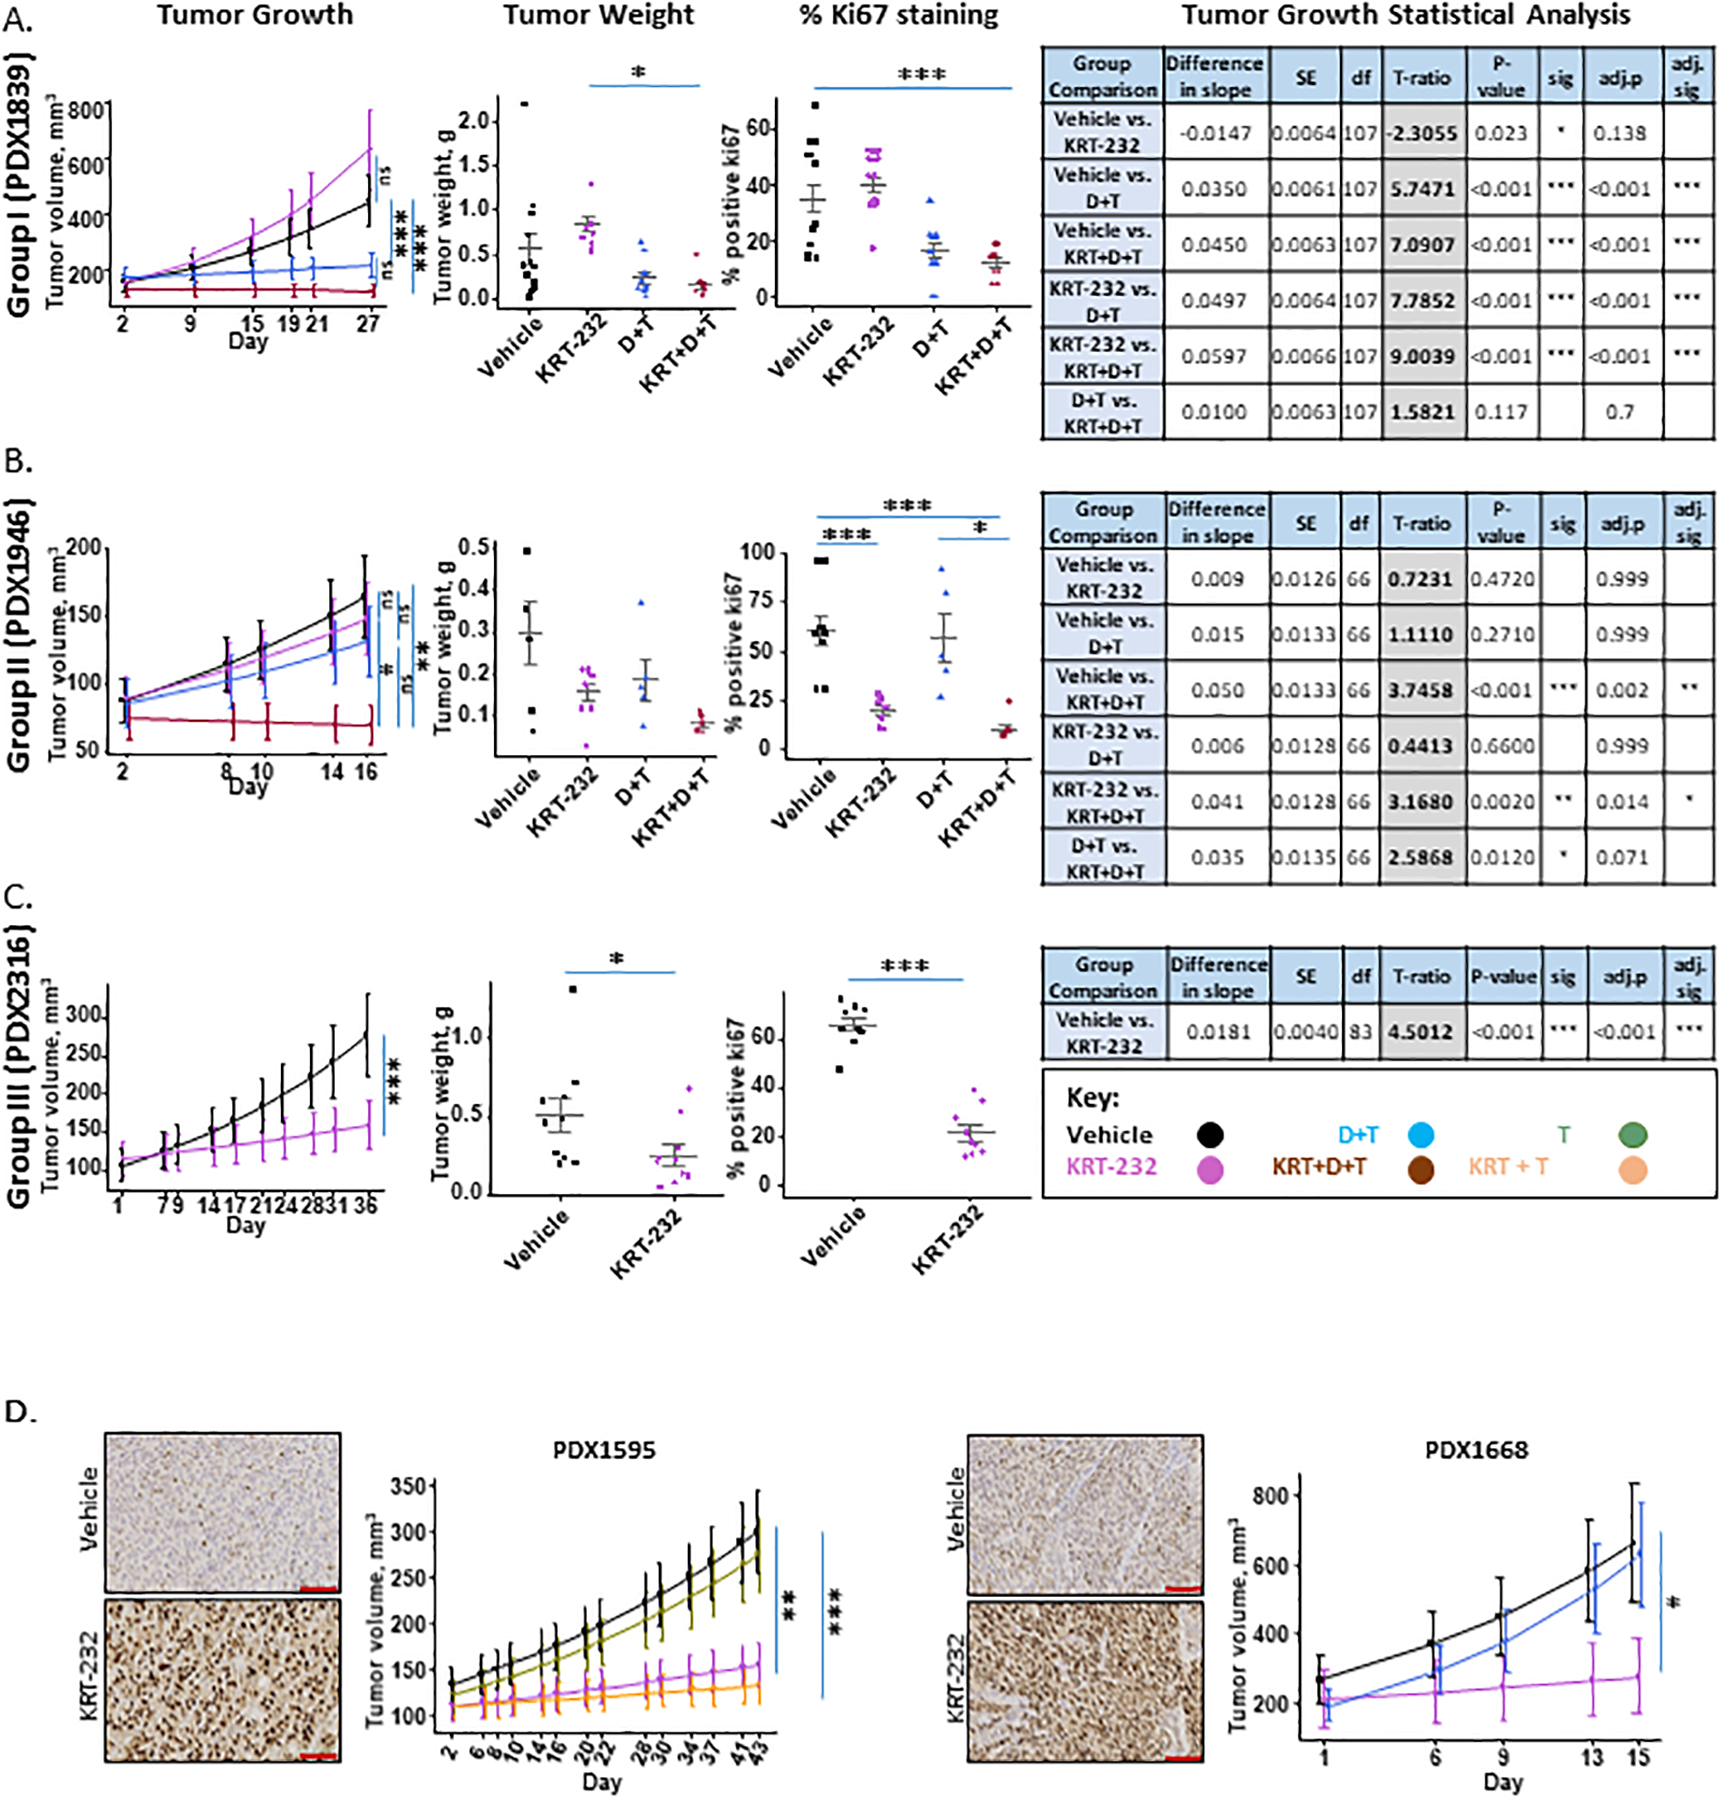
Figure 1. Response to KRT-232.

The response to drug treatment was divided into three separate categories. Figure 1A, exemplified by PDX1839 represents those PDX tumors that responded to dabrafenib and trametinib (D+T) but not KRT-232 (Group I). Figure 1B, exemplified by PDX1946, represents those PDX tumors that did not respond to D+T or KRT-232 but did respond synergistically to both (Group II). Figure 1C, exemplified by PDX2316, and Figure 1D, with PDX1668 and PDX1595, represent those PDX tumors that responded to KRT-232 but not D+T (Group III). Each panel in A-C includes data showing the effect of drug treatments on Tumor Growth, Final Tumor Weight, %Ki67 Staining and the Tumor Growth Statistical Analysis. Tumor volume was analyzed on the natural log scale to better meet normality assumptions and the predicted mean and standard error of tumor volume over time for each treatment group is shown. Dot plot of tumor weight (g) by treatment and % positive Ki67 by treatment (gray line: mean with standard error) are shown. A t-ratio table for pairwise comparison in tumor growth rate between treatments based on the mixed-effect model with post hoc tests is shown. Figure 1D, KRT-232 treatment increases the nuclear localization of P53. IHC staining of huP53 in melanoma PDX tumors from mice treated with the vehicle or KRT-232. 20X images are shown and the scale marker is 100μm. Tumor growth is also shown. The standard therapy for PDX1595 was trametinib and for PDX1668 the standard therapy was dabrafenib + trametinib.
