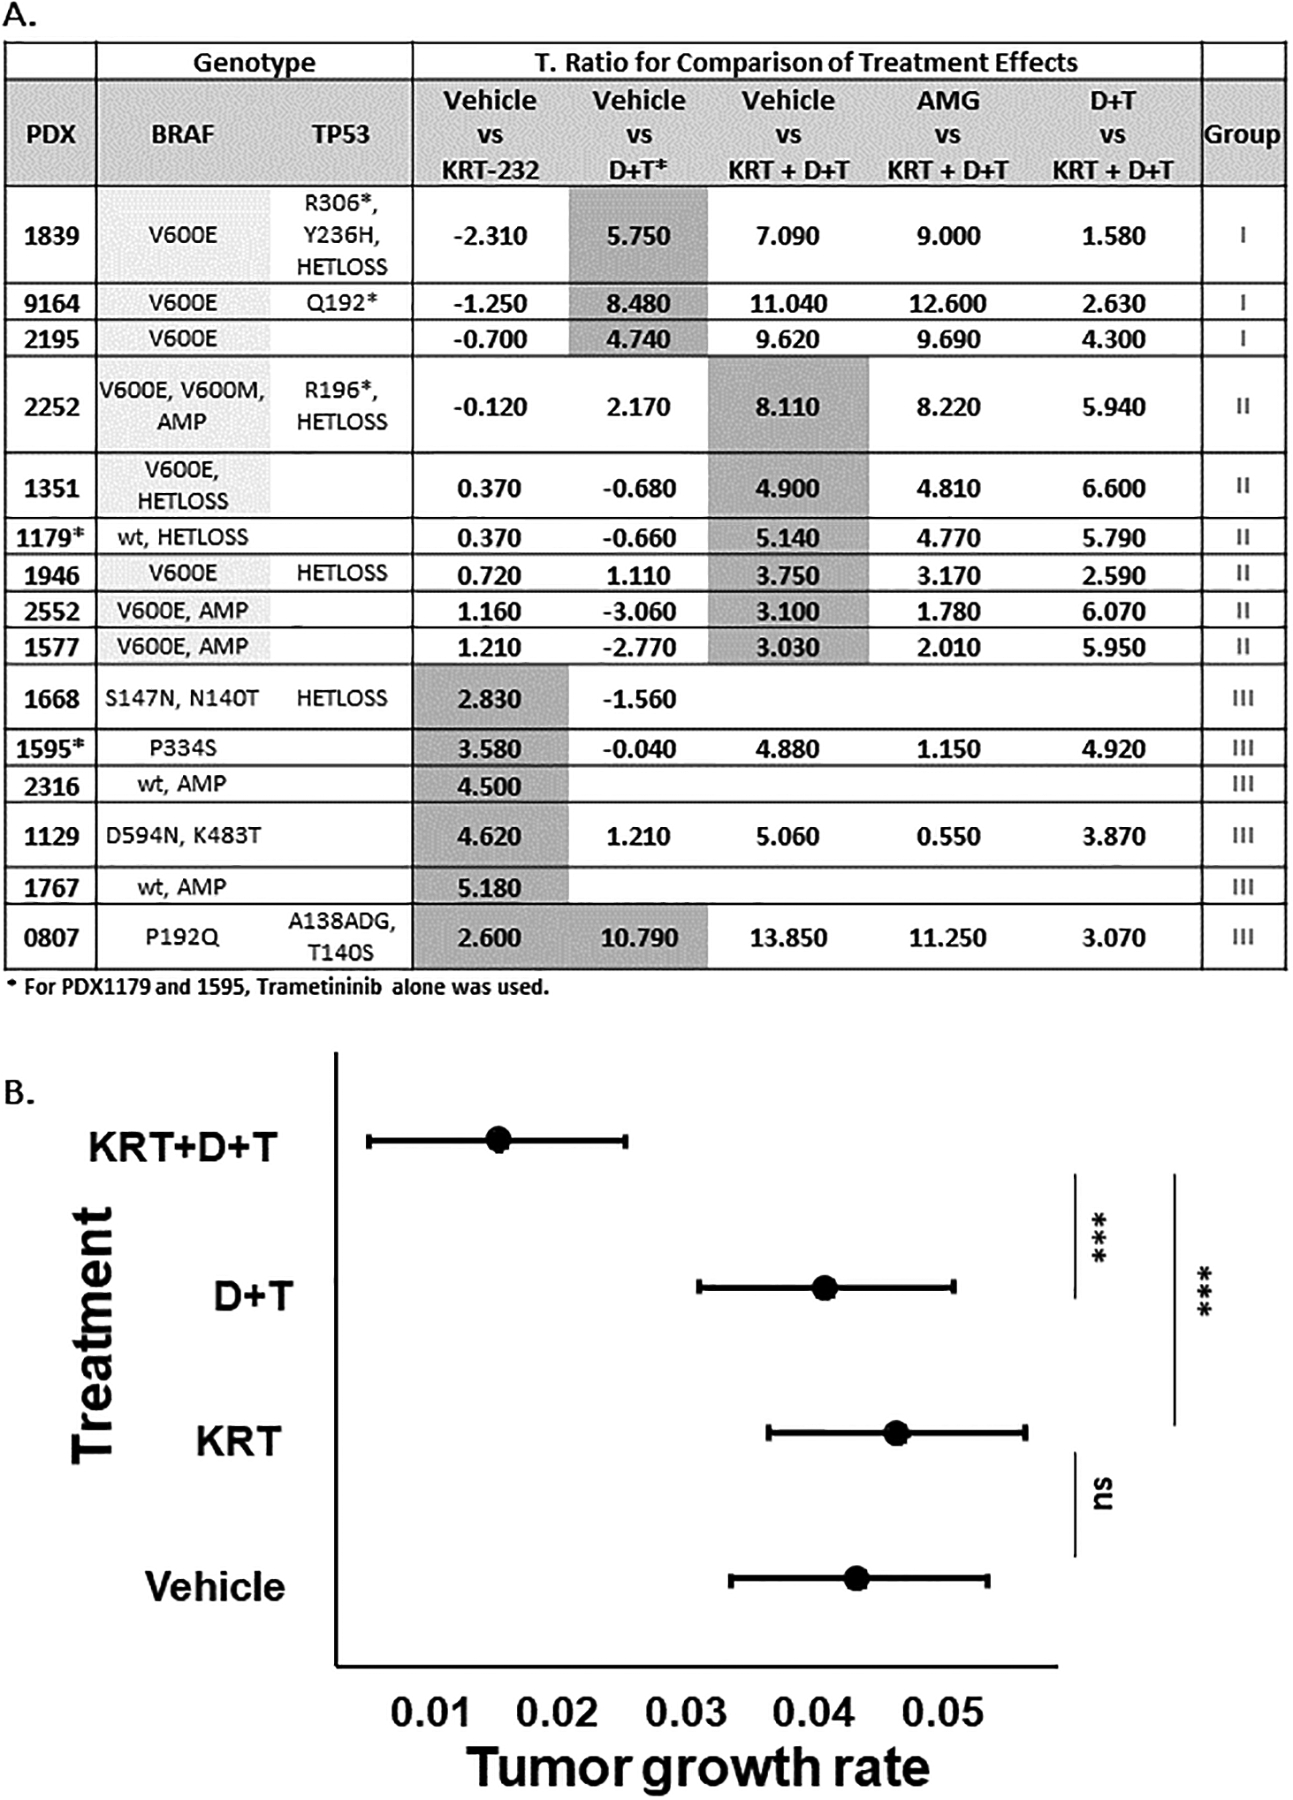
Figure 2A, Statistical Summary Table of T-ratio.

The t-ratio, obtained from the statistical analysis of treatment difference comparisons of the tumor growth rate based on the tumor volume, for each PDX treatment comparison, is listed. The BRAF and TP53 mutational status of each PDX is also listed. The group assignment, shown in the final column, is based on the response to KRT-232 and T+/−D treatment. Figure 2B, Analysis of Synergy. The mean estimated tumor growth rate of 4 independent PDX Group II lines is graphed with a 95% confidence interval by treatment. Mice implanted with PDX1351, 1577, 1946, and 2552 were treated in vivo with Vehicle, KRT-232, D+T, or KRT-232+D+T as described in Figure 1.
