
Figure 3A, Alterations in Cell Morphology Associated with Synergism.
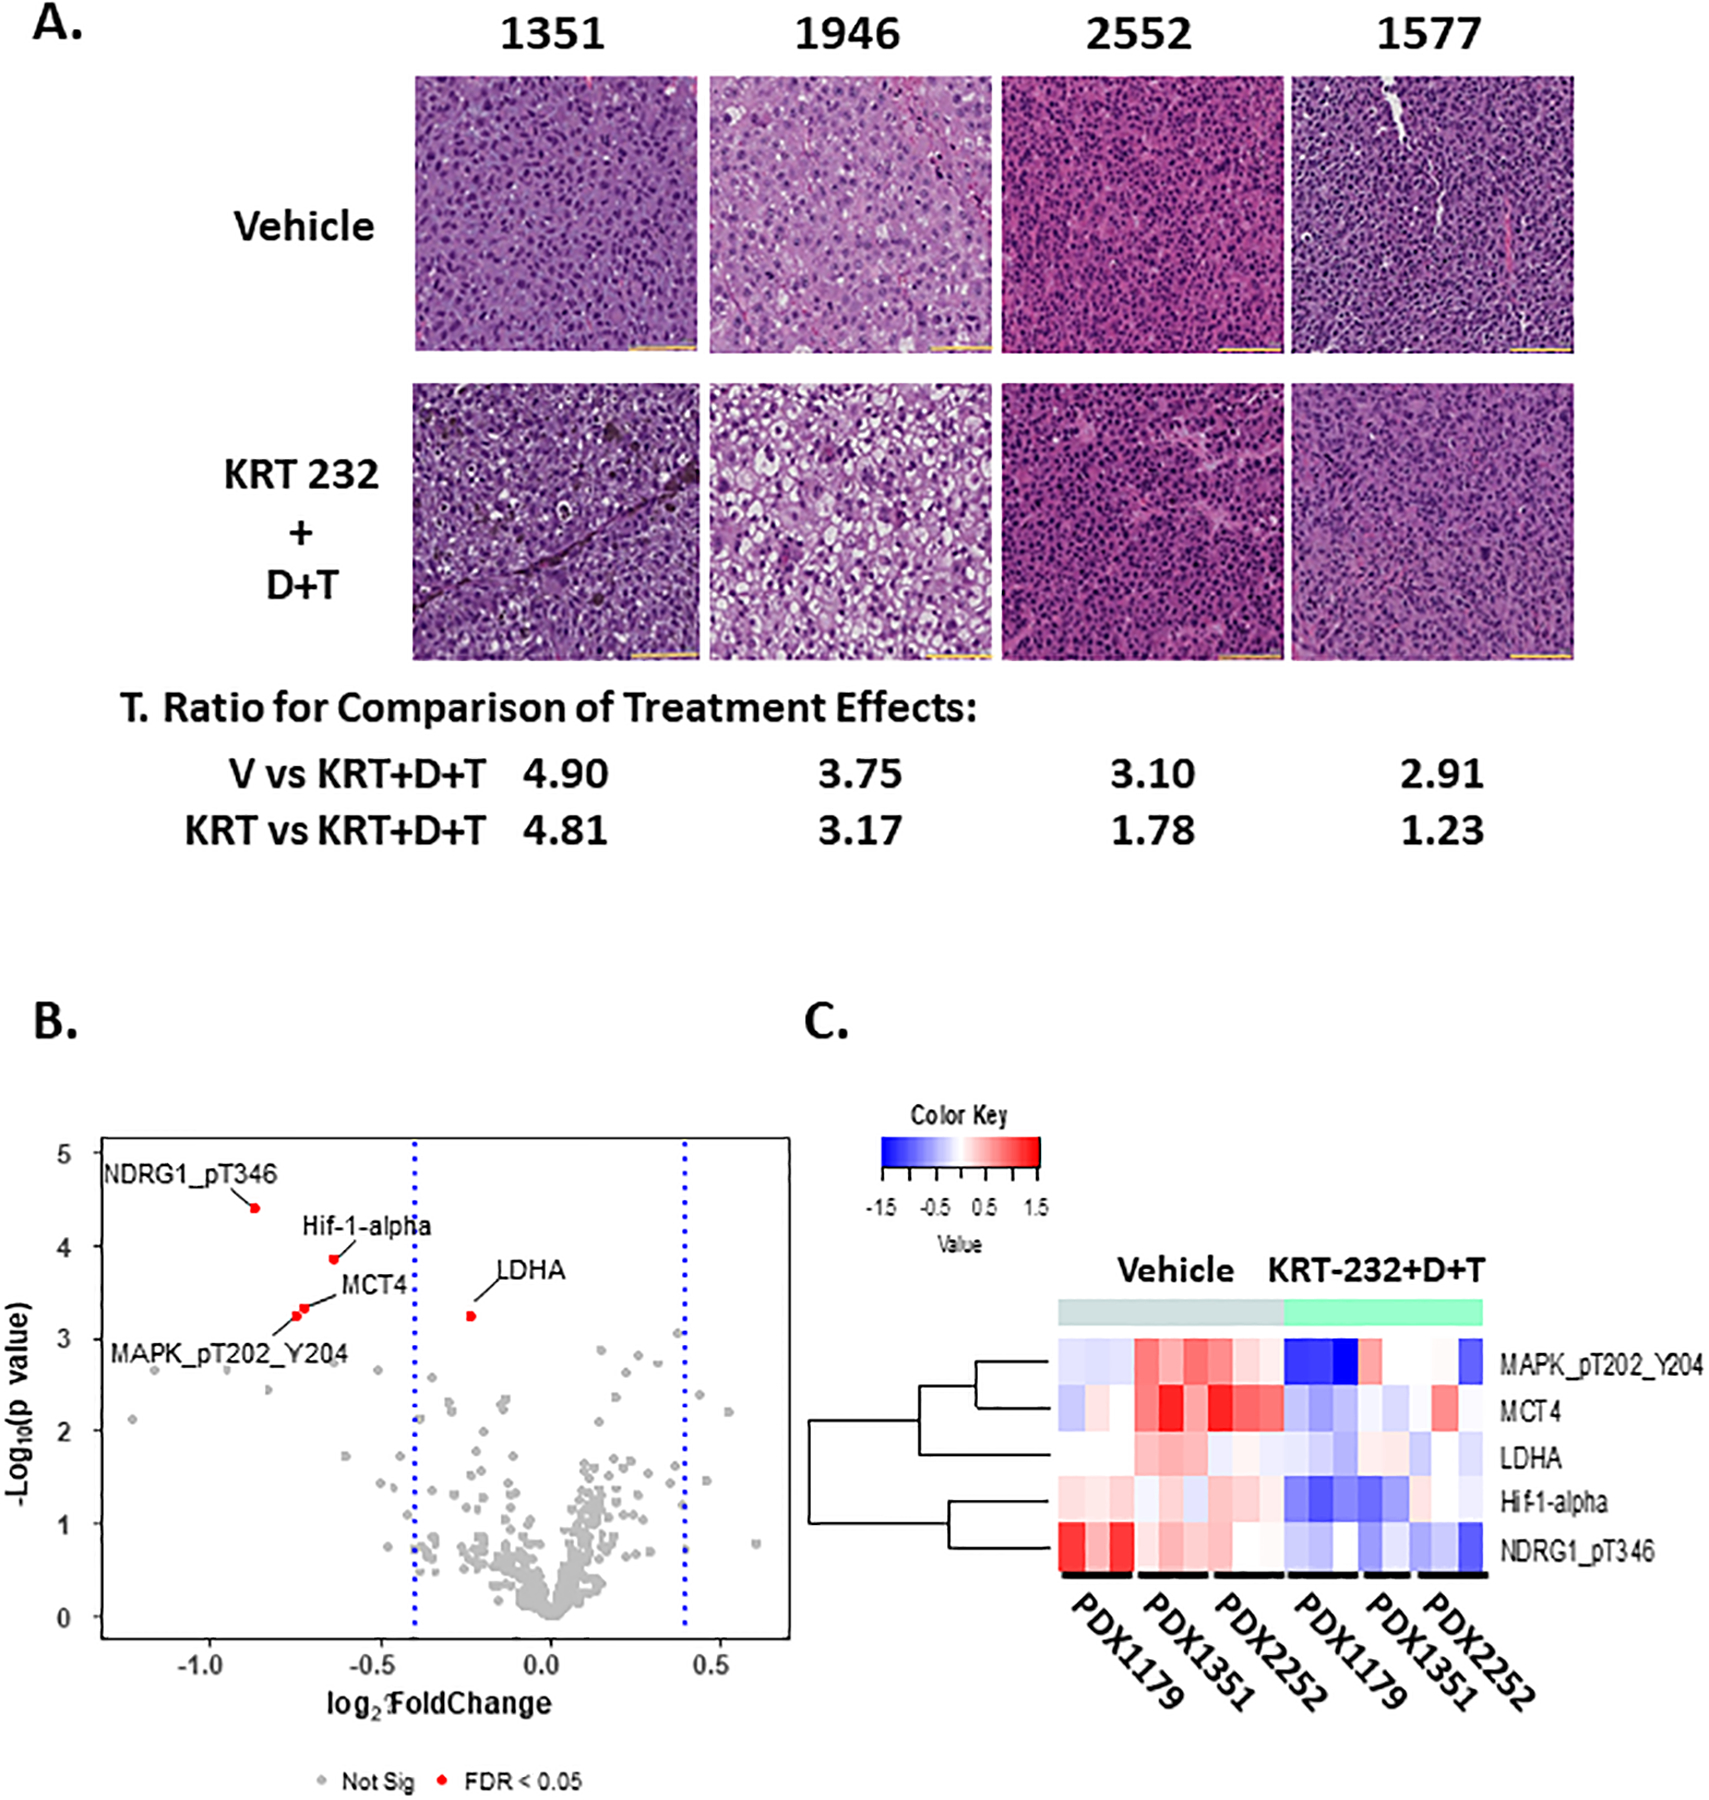
H&E is shown for Vehicle and KRT-232 + D+T treated mice implanted with PDX1351, PDX1946, PDX2552 and PDX1577 (Group III). The t-ratio for the statistical difference between the vehicle or KRT-232 treatment group compared to the KRT-232+D+T treatment group is shown. 20X images are shown and the scale marker is 100μm. Figure 3 B & C, Alterations in Protein Expression Associated with Synergism. A volcano plot (B) and a heat map (C) of RPPA data obtained from vehicle-treated and KRT-232 + D+T treated Group III PDX tumors samples for PDX1179, PDX1351, and PDX2252 is shown. Three tumors were analyzed for each PDX treatment. Only those proteins with an FDR <0.05 and log2(FC)=+/− 0.4 were included in the heat map.