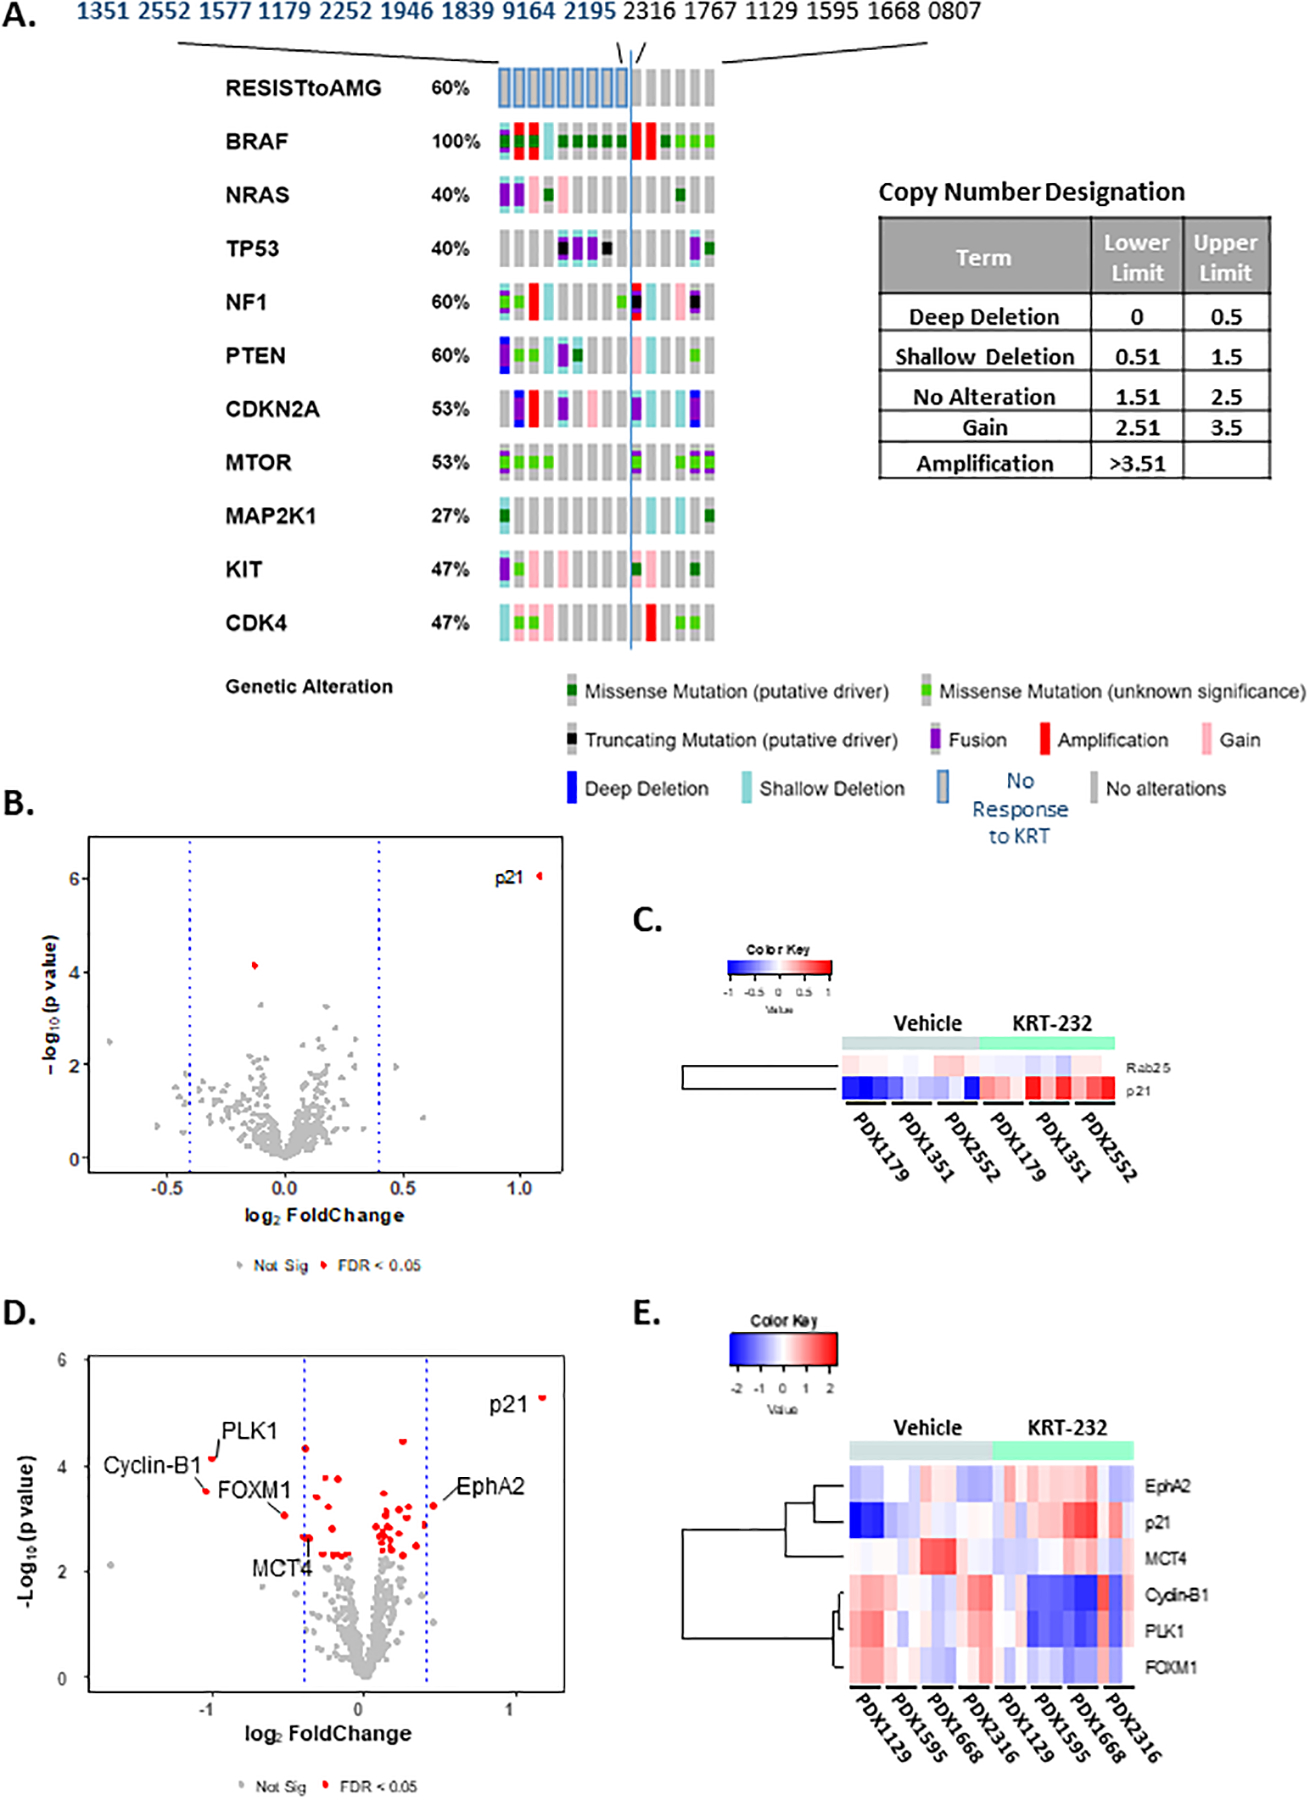
Figure 4A, Biomarkers as Predictors of KRT-232 Response. Oncoprint Cluster Analysis.

DNA sequence analysis was performed using NextGen sequencing. Paired targeted analysis for all 15 PDX tumors was performed using Oncoprint on the cBioPortal (http://www.cbioportal.org/) hosted by Sloan Kettering Institute. These results show the analysis of the 10 genes listed in Table 1. The inset table lists the brackets and terms used to describe the copy number variations. Figure 4 B-E, Comparison of RPPA Analysis Between Group II and III PDX tumors Treated with KRT-232. Volcano plots (B&D) and heat maps (C&E) of RPPA data obtained from vehicle-treated and KRT-232 treated Group II (B&C) and Group III PDX (D&E) tumors samples. Three tumors were analyzed for each PDX treatment. Group II PDX tumors were PDX1179, 1351 and 2552 and Group III PDX tumors were PDX1129, 1595, 1668 and 2316. Only those proteins with an FDR <0.05 and log2(FC)=+/− 0.4 were included in the heat map.
