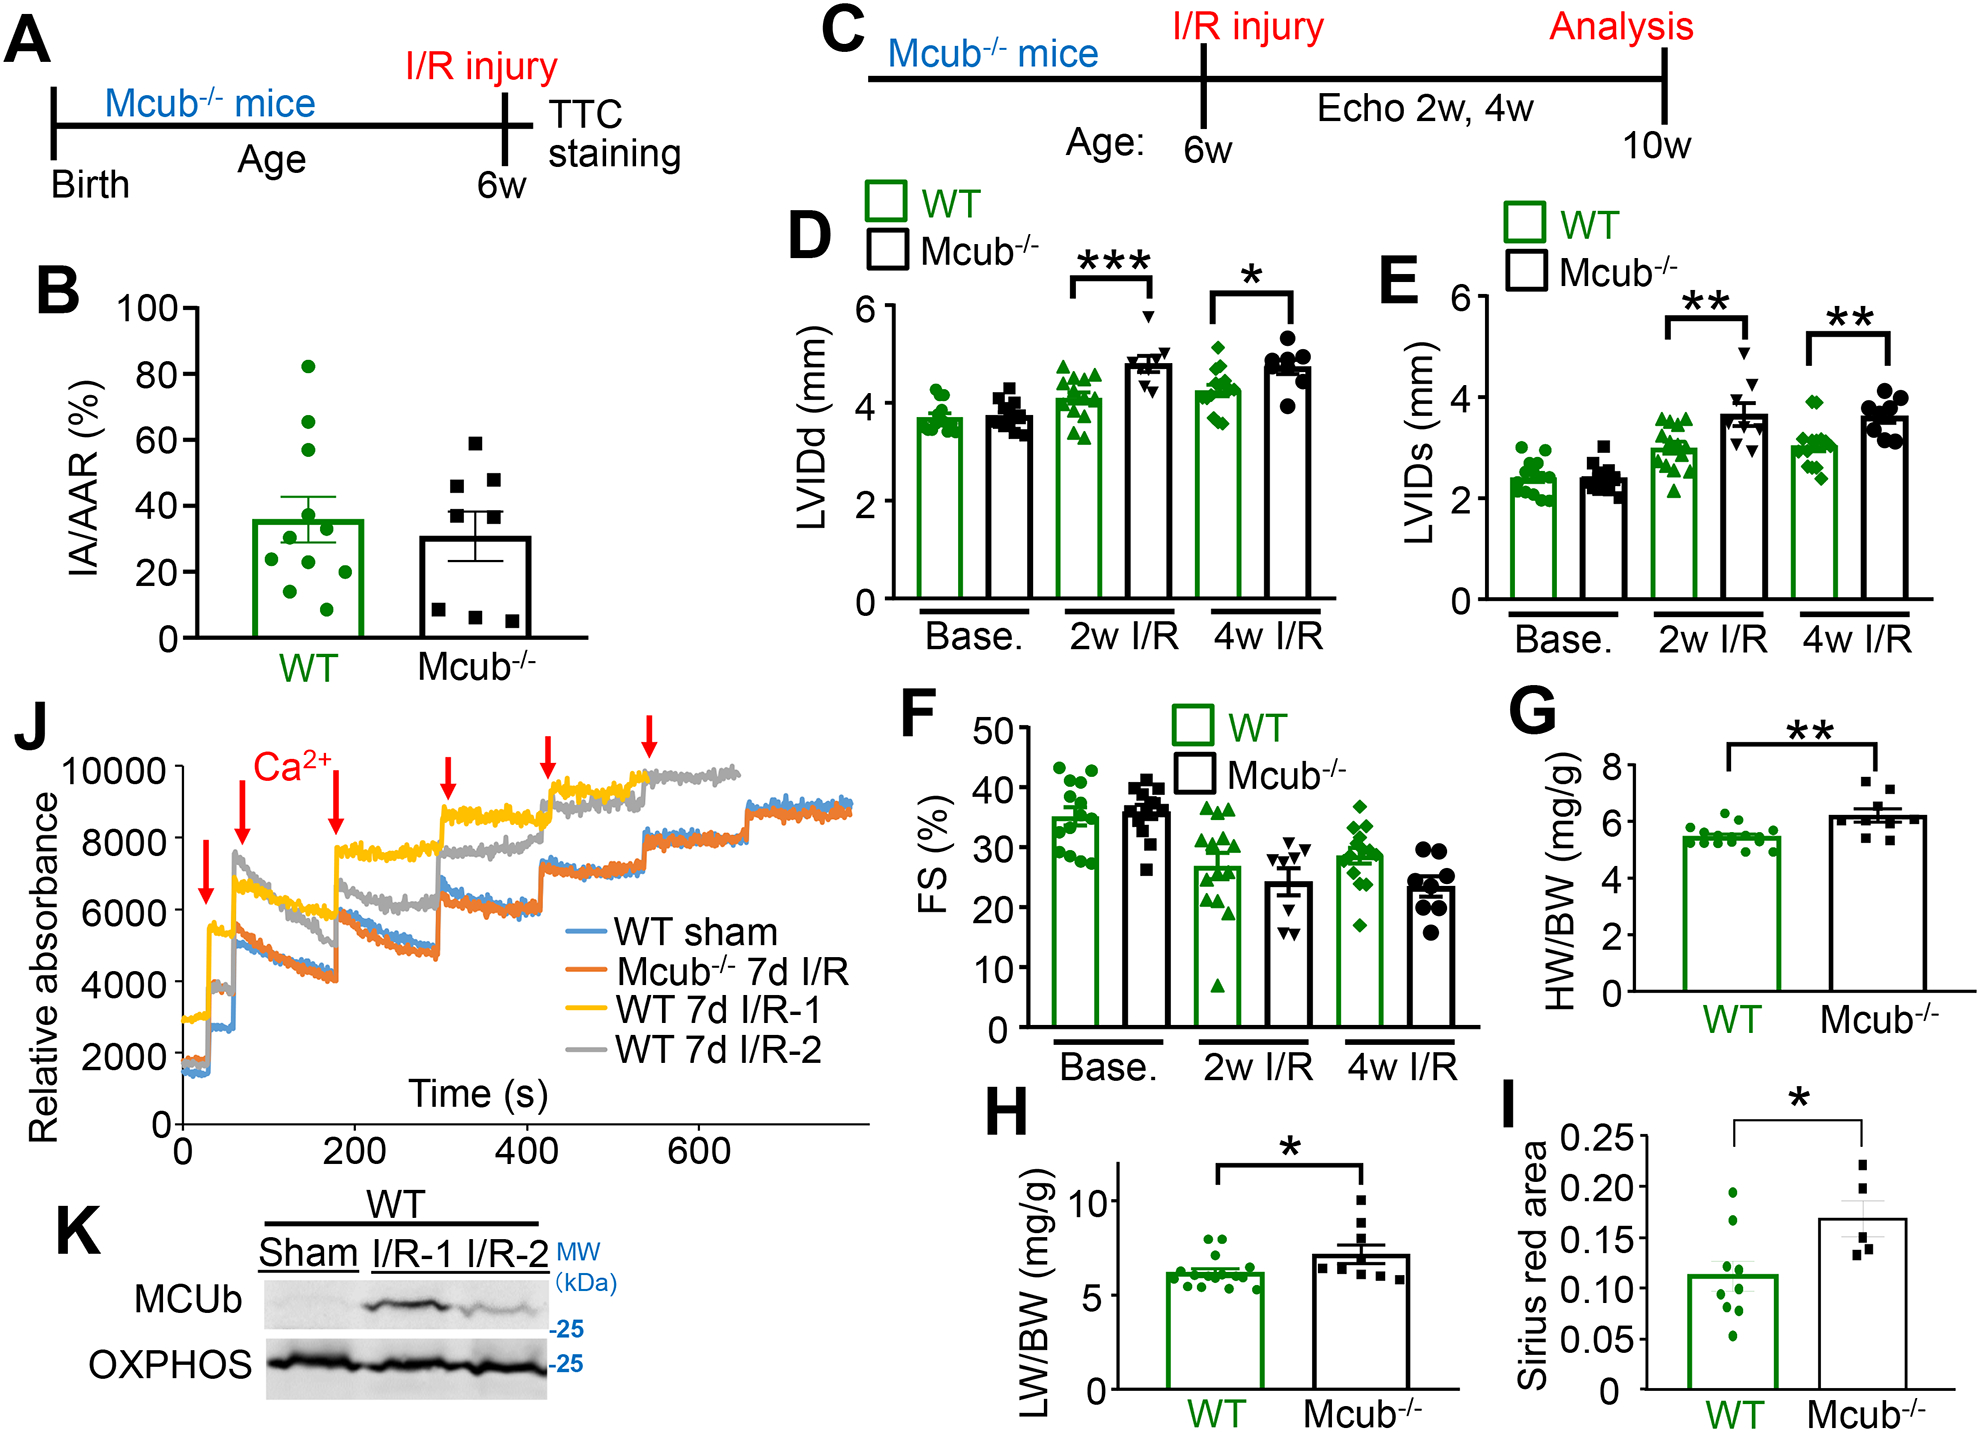
Figure 5. Cardiac MCUb protein induction protects the heart from damage post I/R injury.

A) Temporal schematic of the I/R injury model in mice for panel “B”. Mice at 6 wks of age were challenged with 60 minutes of ischemia followed by 24 hours of reperfusion. Hearts were sacrificed for TTC staining. B) Both IA and AAR were analyzed and averaged for the indicated groups following I/R injury. n=11 in WT group, n=8 in Mcub−/− group. Data presented as mean ± SEM. Student’s t-test was used for statistical analysis. C) Temporal schematic of the strategy for assessing infarct expansion following I/R injury, for panels “D-H”. Mice at 6 wks of age were challenged with 60 minutes of ischemic injury. Echocardiographic measurements were performed before injury, then 2 and 4 wks of reperfusion. Mice were sacrificed at the 4 wk time point for additional analyses. D-F) Echocardiographic parameters in the indicated groups of mice at the indicated timepoints. LVIDd, end-diastolic left ventricle internal diameter; LVIDs, end-systolic left ventricle internal diameter; FS, fractional shortening. n=14 in WT group, n=12 in Mcub−/− group at baseline; n=14 in WT group, n=8 in Mcub−/− group post injury. Data presented as mean ± SEM. Two-way ANOVA with a post hoc Bonferroni’s multiple comparison test was performed. For “D&E”, there was a significant interaction (p<0.05) between time and genotype variables. For “F”, there was only a significant time effect (p<0.05) as the two-way ANOVA showed no significant interaction. Markings denote the following: *p<0.05, **p<0.01, ***p<0.001. G–H) Heart weight/body weight (HW/BW) ratio and lung weight/body weight (LW/BW) ratio in the indicated groups of mice 4 wks post I/R injury. n=14 in WT group, n=9 in Mcub−/− group. Data presented as mean ± SEM. Student’s t-test was used for statistical analysis. *p<0.05, **p<0.01. I) Quantification of Sirius Red staining of histological sections from hearts of mice 4 wks post I/R injury in the indicated groups. n=14 in WT group, n=9 in Mcub−/− group. Data presented as mean ± SEM. Student’s t-test was used for statistical analysis. *p<0.05. J) Mitochondrial Ca2+ uptake in isolated mitochondria from the left ventricle of hearts in the indicated groups of mice. Mice were challenged with sham or I/R injury, and then collected 7 days post injury. K) Western blot of MCUb in the same isolated hearts used in “J”. OXPHOS antibody was used as the protein loading control.
