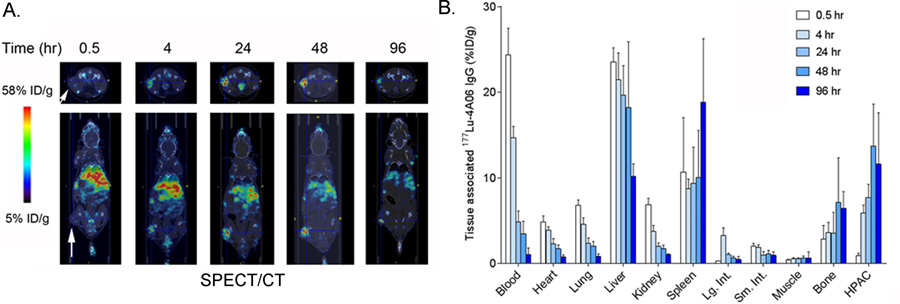
Figure 4. SPECT/CT and biodistribution data shows the accumulation of 177Lu-4A06 IgG1 in HPAC tumors and normal mouse tissues.
A. Representative transverse and coronal SPECT/CT data showing tumor uptake in subcutaneous HPAC tumors (white arrow) over time. As with 89Zr-4A06, the radiotracer uptake in tumors peaks after 48 hours post injection. Nonspecific uptake is observed in abdominal tissues, as expected based on the data with 89Zr-4A06. B. Ex vivo biodistribution data showing the accumulation of 177Lu-4A06 in tissues over time (n = 4/time point). The biodistribution is qualitatively similar to what was observed with 89Zr-4A06.

