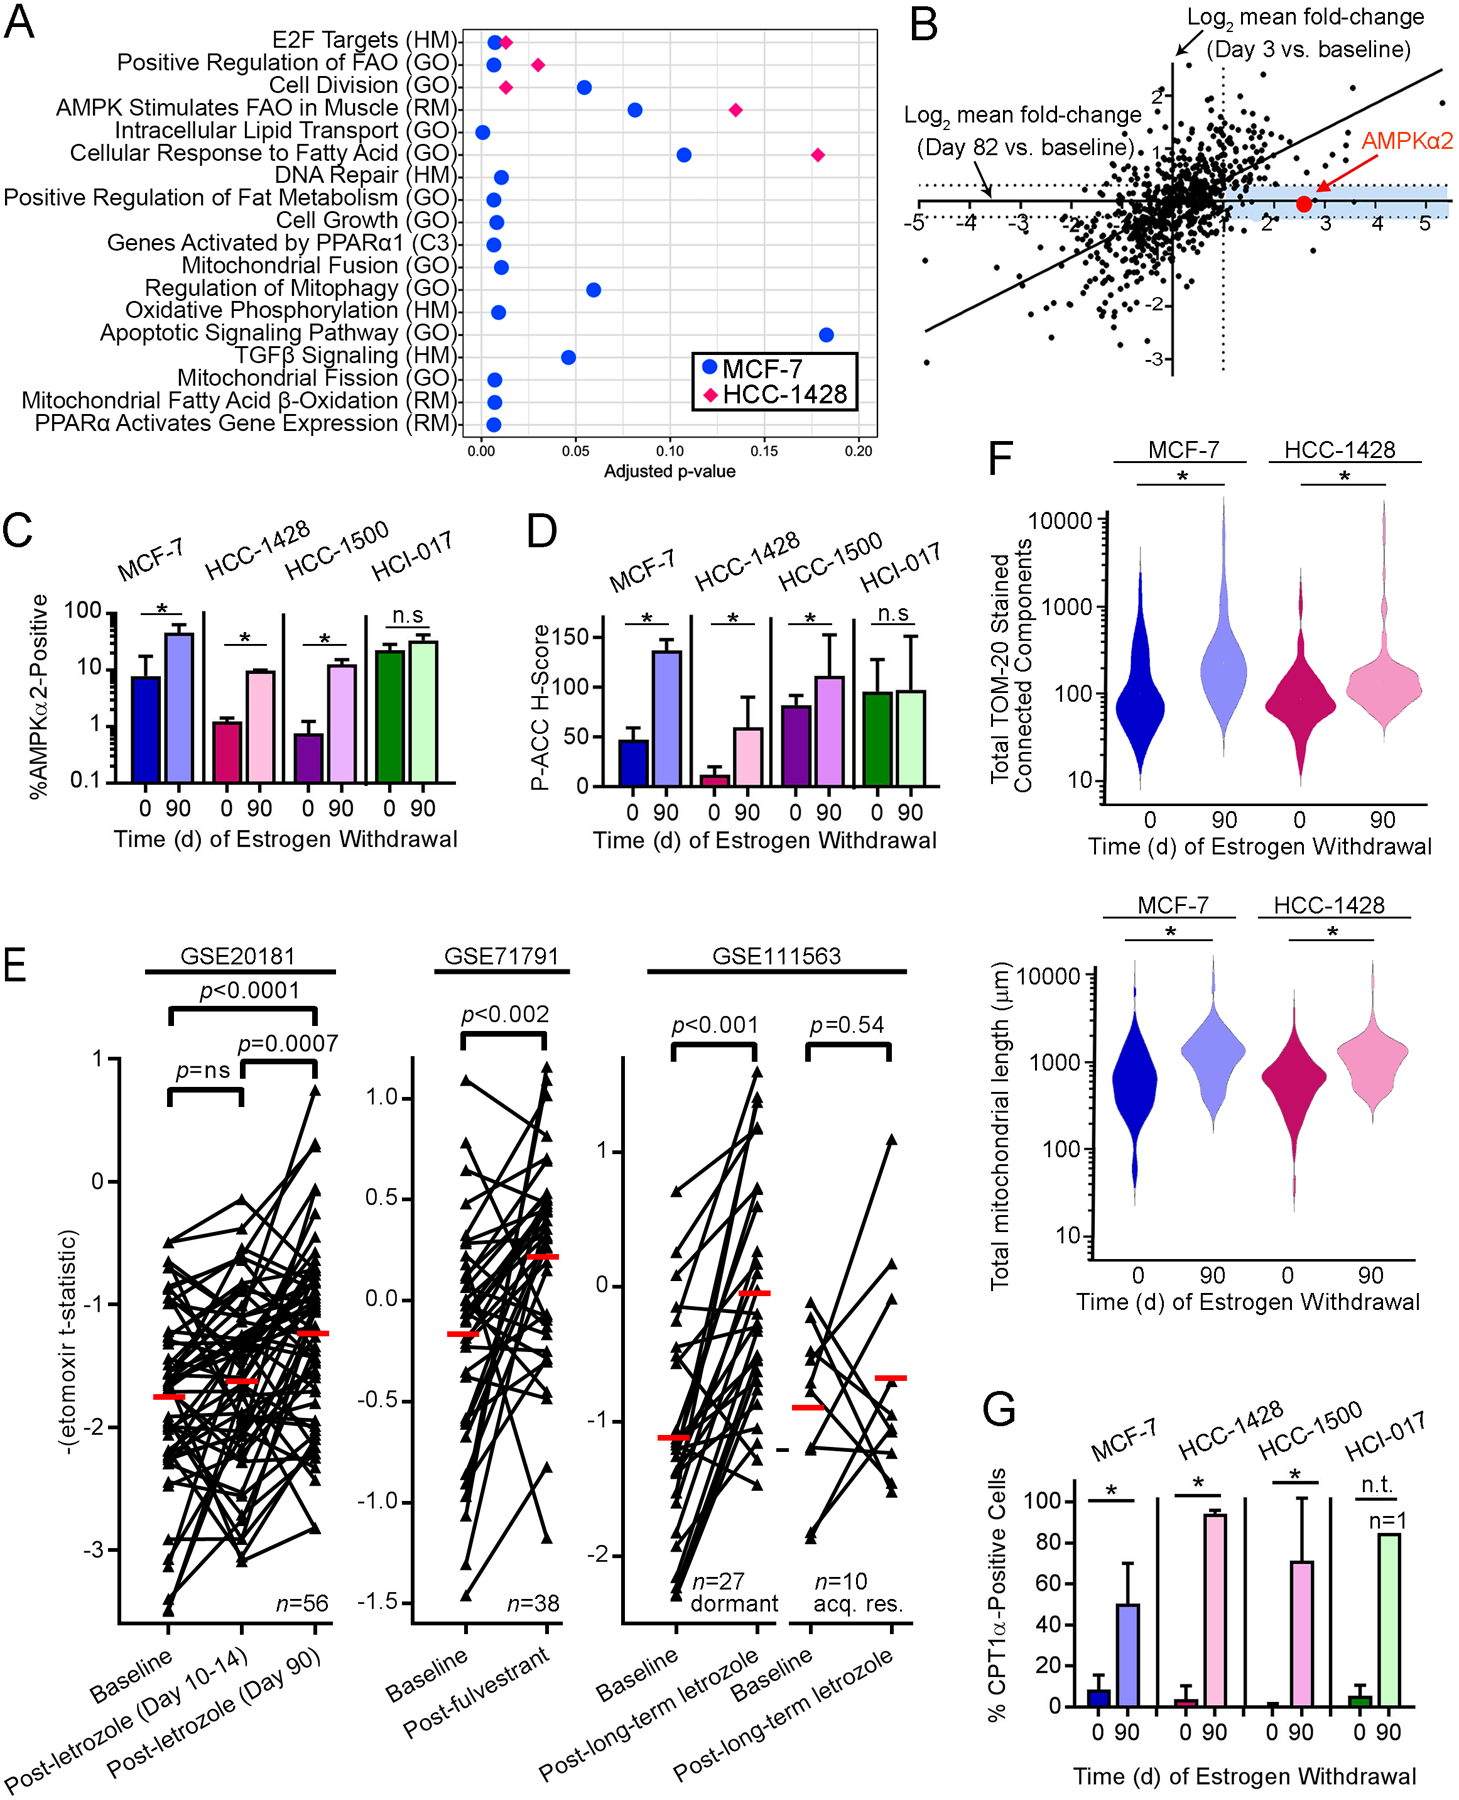
Fig. 2. Dormant ER+ breast tumor cells exhibit increased AMPK levels and activity.

(A) RNA from MCF-7 and HCC-1428 xenografts after 0 or 90 d of EW (n=3–4 per time point) was analyzed by RNA-seq. Gene expression changes detected in 90-day tumors vs. baseline were analyzed by unsupervised sample-wise enrichment analysis of metabolic and signaling gene sets using GSVA. Gene sets with adjusted p≤0.2, which is below the recommended cutoff of p=0.25 for significance in Gene Set Enrichment Analysis (50), are shown. (B) RNA from MCF-7 xenografts after 0 d (n=2), 3 d (n=3), or 82 d (n=4) of EW was analyzed using the NanoString PanCancer Pathways Panel. Mean fold-change for each gene at 3 d or 82 d relative to baseline was calculated. Blue shading highlights genes with expression increased ≥2-fold in dormant tumor cells (82 d) but not in acutely EW tumors (3 d). (C/D) IHC for AMPKα2 and P-ACCSer79. Data are shown as mean of triplicates +SD. *p≤0.05 by t-test compared to control. n.s.-not significant. (E) Human ER+ breast tumor etomoxir t-statistics from tumors sampled before and after neoadjuvant endocrine therapy were compared by paired t-test. acq. res.-acquired resistant. Red bars indicate mean values. (F) Mitochondria were stained with TOM20-AF594 using triplicate tumors. Mitochondrial count (left) and length (right) per cell (from ≥30 cells/tumor) are shown as violin plot. *p≤0.05 by t-test. (G) IHC of CPT1α. * t-test p≤0.05. n.t.-not tested (lack of replicates).
