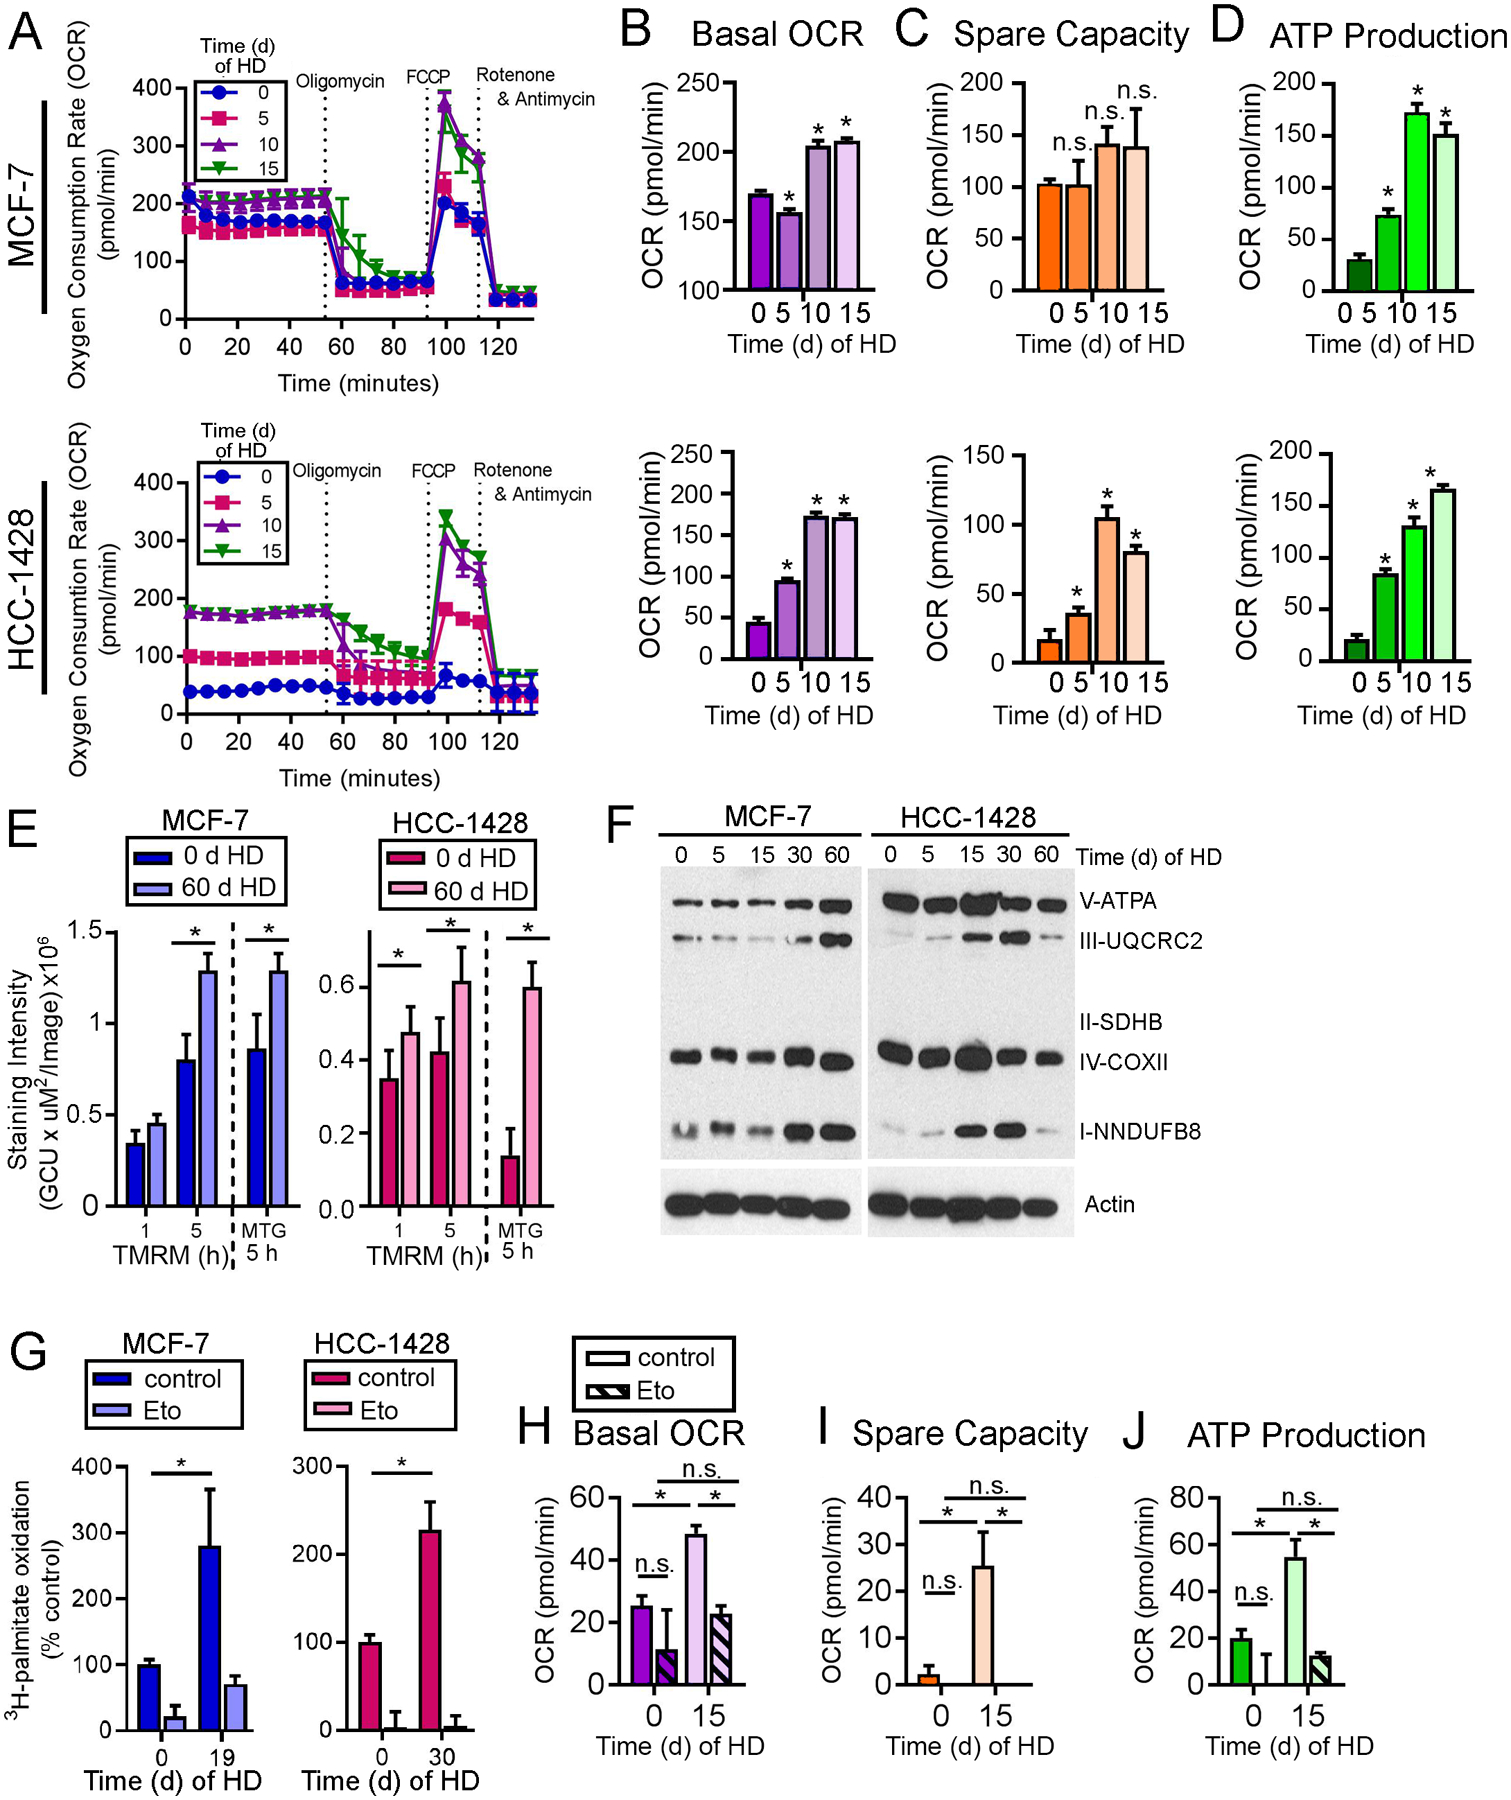
Fig. 3. AMPK drives oxidative metabolism under HD conditions.

(A-D) OCR was measured in cells treated with HD ±1 nM E2 for 15 d. Basal OCR (B), spare capacity (C), and ATP production (D) were calculated. (E) Cells were treated with HD ±1 nM E2, then stained with TMRM or MTG as indicators of mitochondrial membrane potential. (F) Lysates from cells treated with 0–60 d of HD were analyzed by immunoblot. (G) Cells were treated as in (A), then treated with medium containing 3H-palmitate ±20 μM etomoxir for 24 h prior to assay. FAO was normalized to HD + E2 control. (H-J) MCF-7 cells were treated with HD ±1 nM E2 for 15 d, ±200 μM etomoxir for 24 h prior to assay. OCR was measured as in (A-D). In (B-D) and (H-J), *p≤0.05 by Bonferroni multiple comparison-adjusted posthoc test vs. baseline unless indicated. In (E/G), * t-test p≤0.05. n.s.-not significant. In all quantitative experiments, data are shown as mean of triplicates +SD.
