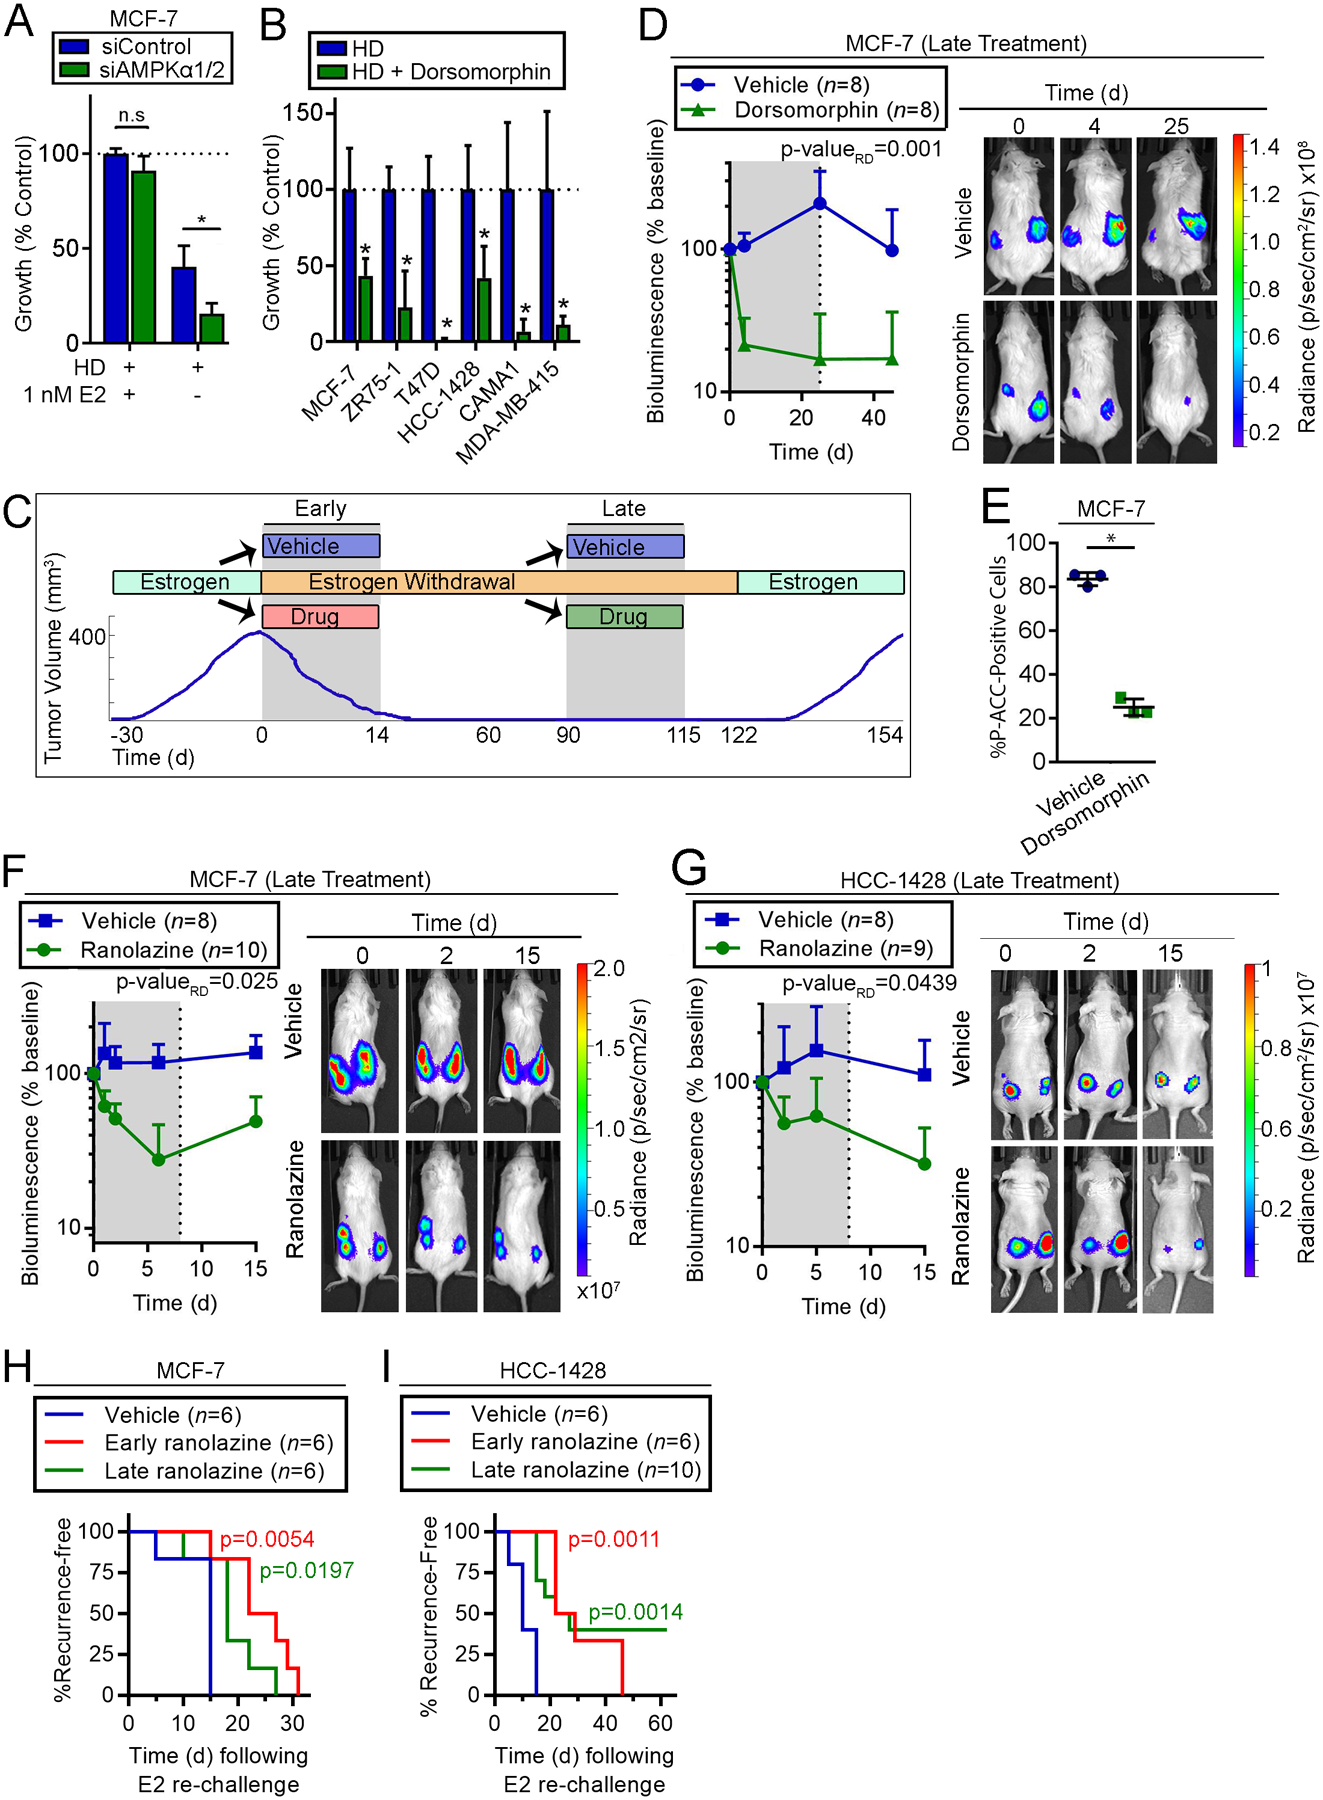
Fig. 4. AMPK activity and fatty acid oxidation are essential for survival of dormant ER+ BC cells.

(A) siRNA-transfected cells were treated with HD ±1 nM E2. Relative cell numbers measured after 7 d are shown as mean of triplicates +SD. (B) Cells were treated with HD ±5 μM dorsomorphin for 21–28 d and analyzed as in (A). (C) Schematic of experiments performed in (D-I). Ovx mice with E2-induced tumors were randomized to drug treatments either i) at the time of EW (“Early”), or ii) after 60–90 d of EW (“Late”). Tumor volume or bioluminescence was monitored before (Day 0), during (gray shading) and after drug treatments. (D) Mice with tumors that completely regressed after 90 d of EW were treated (“Late”) ± dorsomorphin for 25 d. Relative numbers of residual tumor cells were serially measured by bioluminescence imaging. Data are shown as mean +SD. Exposure-matched images from one representative mouse per group are shown. (E) Tumors from mice treated as in (D) were harvested 24 h after one dose. IHC was performed for P-ACCSer79. Bars indicate mean of triplicates ± D. (F/G) Mice with tumors that completely regressed after 60 d of EW were treated (“Late”) ±ranolazine for 7 d, and analyzed as in (D). (H/I) Tumor-bearing mice were treated with EW +/-ranolazine: “Early” treatment was EW + ranolazine (14 d) administered to tumor-bearing mice, followed by 97 d of EW alone; after 90 d of EW, “Late” treatment was EW + ranolazine (7 d) administered to mice with completely regressed xenografts, followed by 7 d of EW alone. Mice without palpable tumors were then re-challenged with E2, and tumor recurrence was detected by palpation. Recurrence-free survival curves were compared to vehicle group by log-rank test. In (A/B/E), *p≤0.05 by t-test compared to control unless indicated. n.s.-not significant. In (D/F/G), bioluminescence signal values were compared by non-linear effect modeling.
