
Fig. 1. Vimentin and E-cadherin expression levels in proximal tubular cells of kidneys in Control, ZnT8-KO, STZ-induced diabetic and ZnT8-KO-STZ mice.
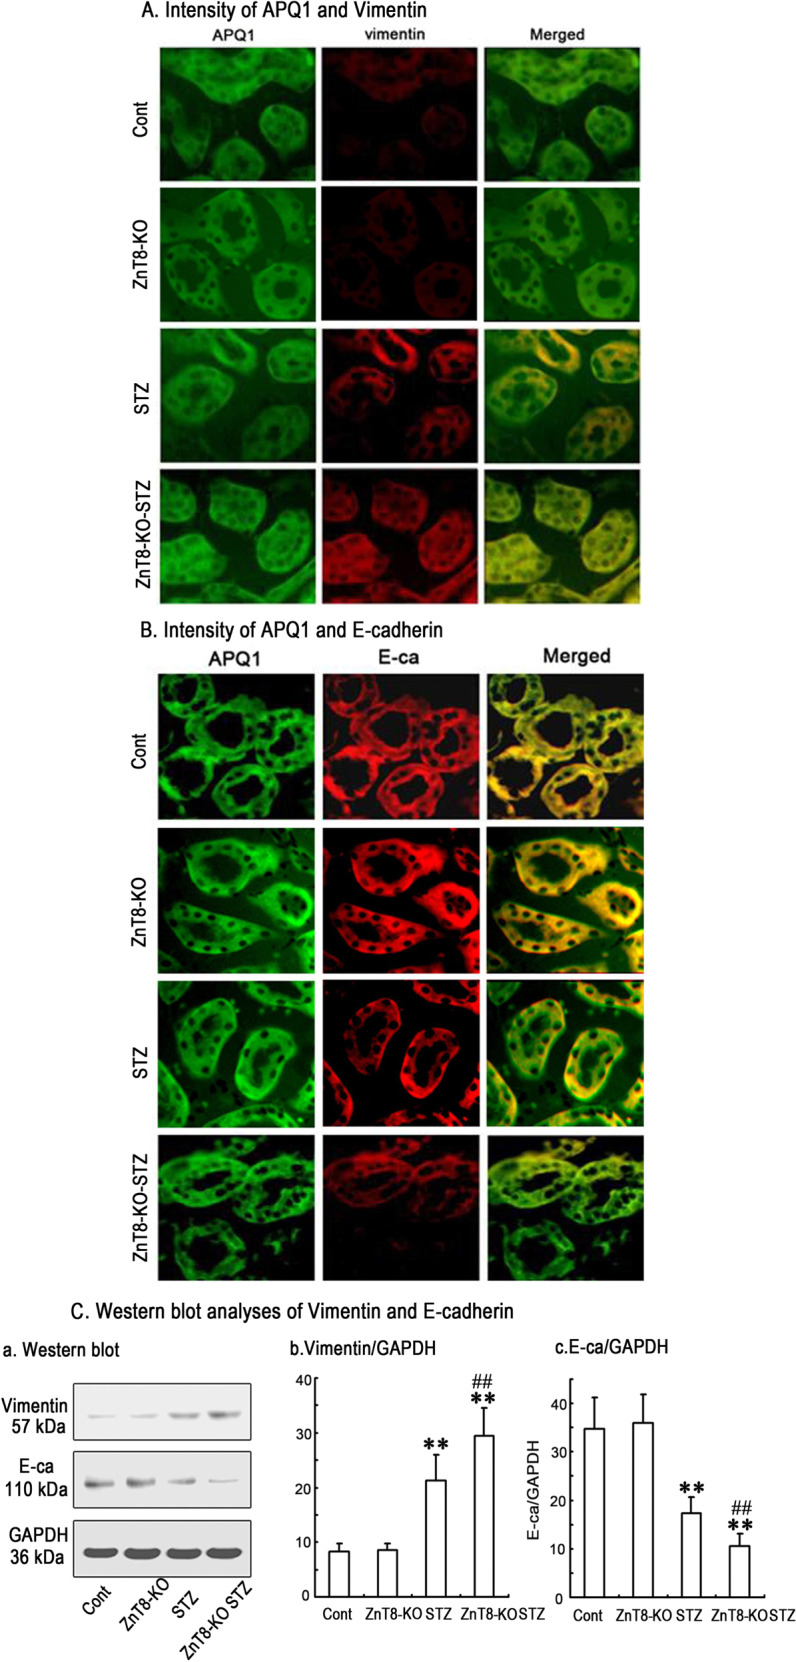
In the initial experiments, immunofluorescence staining images demonstrated the localization of Vimentin (red) and E-cadherin (red) in the proximal tubular cells of kidneys of Control (a1-3), ZnT8-KO mice (b1-3), STZ-induced diabetic (c1-3) and ZnT8-KO-STZ mice (d1-3) and data are represented in a, b, respectively. AQP1 (green) is the marker for tubular cells. Original magnification, ×400. Data from Western blotting analyses were followed in C. Relative expression of Vimentin and E-cadherin was calculated and normalized to the loading controls. The experiments were repeated for three times (**P < 0.001 vs. Control mice and ##P < 0.001 vs. STZ-induced diabetic mice).