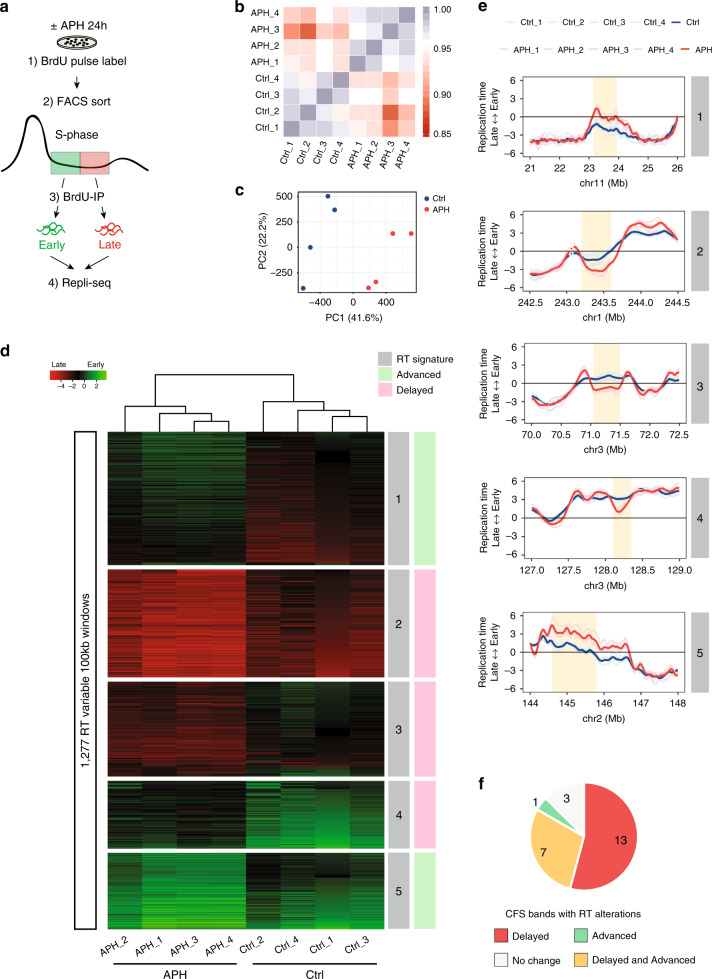
Fig. 1. Aphidicolin affects the RT of specific genomic regions.
a Schematic description of Repli-seq. BJ-hTERT cells with (+) or without (−) APH treatment were pulse labeled with BrdU and sorted into early and late S phase, and the RT programs were obtained by next-generation sequencing. b Correlation matrix of genome-wide RT programs of BJ-hTERT cells with (APH) or without (Ctrl) APH treatment. Four replicates per condition are presented (1–4). c Principal component analysis (PCA) of genome-wide RT showing the 1st and 2nd components for control (blue) and APH-treated cells (red). d Identification of APH-specific RT signatures, distinguishing APH-treated cells (APH) from non-treated control cells (Ctrl). Unsupervised k-means clustering analysis of RT-variable regions identified specific RT signatures (labeled in gray boxes). The heat map shows the RT ratios [= log2(early/late)]. e Exemplary RT profiles of RT signatures. Numbering according to RT signature in (d). The RT profiles are displayed as log2 ratios of signals from early and late S-phase fractions. Positive values correspond to early replication, and negative values correspond to late replication. Four replicates per condition are presented color coded according to the legend (Ctrl in blue, APH in red). Yellow boxes mark the RT-variable regions. f Pie chart indicating RT alterations within CFS cytogenetic bands mapped in BJ-hTERT cells following APH treatment.

