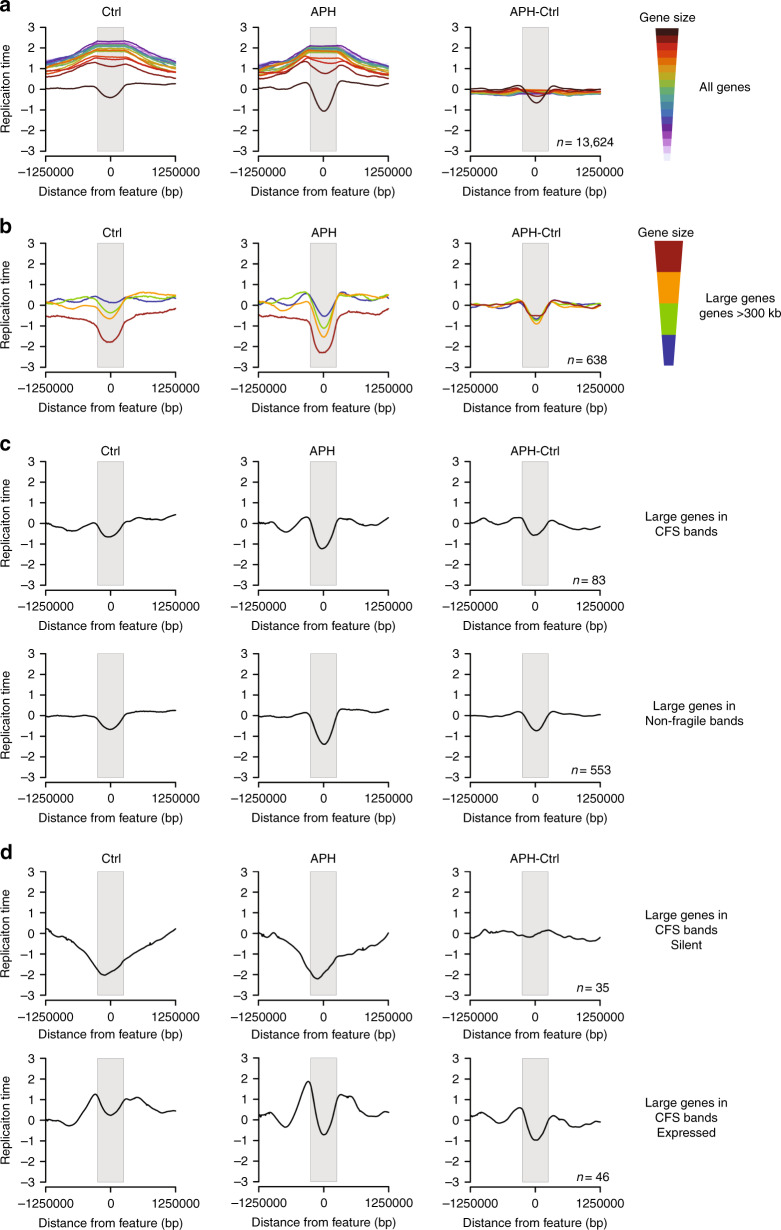
Fig. 3. APH delays the RT of expressed large genes.
a Averaged RT of all genes clustered by size in Ctrl and APH-treated cells. The difference in RT following APH treatment is presented as the subtraction of the RT in Ctrl from the RT in APH-treated cells (APH-Ctrl). Genes are centered at 0 and stretched to fit the gray box, and 1 Mb upstream and downstream the genes are presented. Genes are sorted according to size from top to bottom (largest to smallest, respectively) and color coded by cluster as indicated. b Averaged RT of large genes (>300 kb) are represented as in (a). Genes are sorted according to size from top to bottom (largest to smallest, respectively) and color coded by cluster as indicated in Ctrl, APH, and APH-Ctrl. c Averaged RT of large genes within CFS bands (at the top) and in non-fragile cytogenetic bands (at the bottom) in Ctrl, APH, and APH-Ctrl. d Averaged RT of large genes within CFS bands. At the top are silent genes, at the bottom are expressed genes in Ctrl, APH, and APH-Ctrl.

