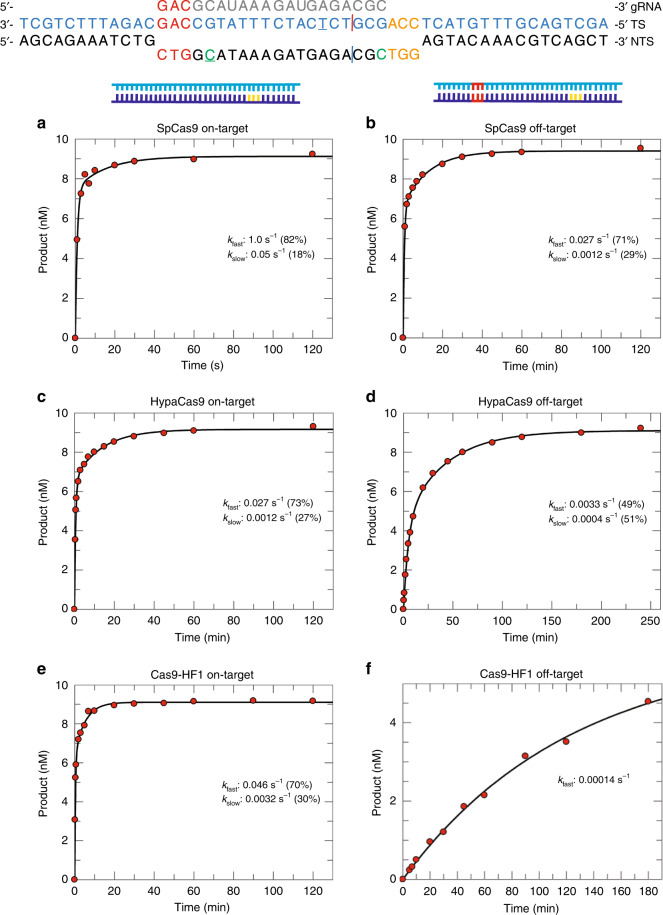
Fig. 1. PAM-distal mismatches dramatically slow cleavage by HypaCas9 and Cas9-HF1.
Schematic of target DNA substrate. PAM site is orange; target sequence is blue; mismatches in the PAM distal region are red; gRNA is colored gray; cleavage sites are shown as red and blue vertical lines for the HNH and RuvC domains, respectively; tCo labeled site at position −16 nt or −1 nt in the non-target strand is green. Cy3 and Cy5 labeled sites at position −6 nt and −16 nt in the target strand and non-target strand, respectively, are underlined. A time course of cleavage of on-target DNA (10 nM) was monitored with 28 nM of each enzyme. Data were fit to a double-exponential equation and the percentage of the total signal occurring with each decay rate is indicated. SpCas9 cleavage of on-target (a) (from Gong et al.15) and off-target (b) DNA. c, d HypaCas9 cleavage with on-target (c) and off-target (d) DNA. e, f Cas9-HF1 cleavage of on-target (e) and off-target (f) DNA. Data in f were fit to a single-exponential function.

