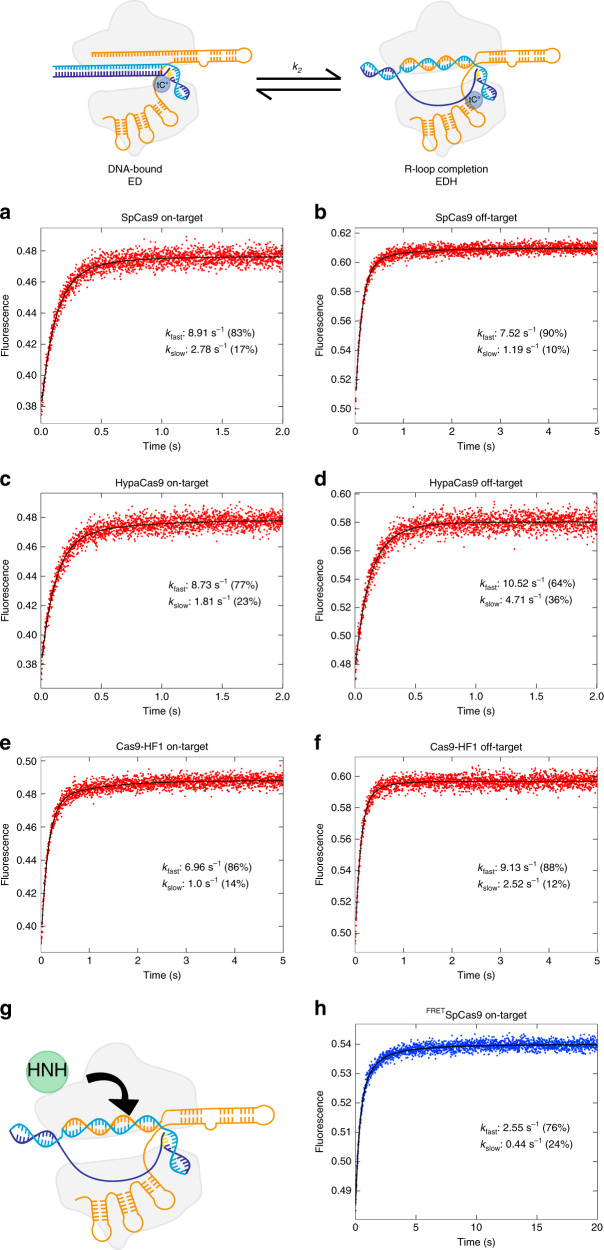
Fig. 3. DNA unwinding occurs more rapidly near the PAM.
R-loop formation decay rates were measured by the monitoring the fluorescence increase from tCo (position −1 in the non-target strand) as a function of time after mixing enzyme (28 nM) with DNA (10 nM) in the presence of 10 mM Mg2+. Data were fit to a double exponential function to get the decay rates shown. a, b SpCas9 (28 nm) with on-target (a) and off-target (b) DNA, c, d HypaCas9 with on-target (c) and off-target (d) DNA. e, f Cas9-HF1 with on-target (e) and off-target (f) DNA. g Cartoon of the HNH domain rearrangement. h The FRETSpCas9 labeled with Cy3 and Cy5 pair at C867 and C355, respectively, was used to measure the HNH domain motion during cleavage of on-target substrates.

